
Translation Efficiency Analysis Reveals Mitochondrial and Chromatin-Related Gene Disruption in Autism Spectrum Disorder Brain Tissue

ABSTRACT
Background
Autism spectrum disorder is a neurodevelopmental condition that affects social communication, behavior, and cognitive function. It affects millions of individuals and families worldwide, and its biological causes involve complex genetic and environmental factors.
Autism can affect social communication, behavior, learning, and cognitive function. These effects can influence quality of life, education, and long-term health outcomes for individuals and their families.
A major challenge is that the molecular mechanisms underlying autism spectrum disorder remain incompletely understood. Although many studies examine messenger RNA abundance, fewer investigate whether messenger RNA is actually being translated into protein, potentially overlooking important biological changes.
It remains unclear translation efficiency, the process by which mRNA is converted into protein, is disrupted in the brains of individuals with autism spectrum disorder and which specific genes and biological pathways are most affected by altered translation efficiency in brain tissues
The goal was to identify genes and biological pathways showing significant disruption in translation efficiency by comparing polysomal RNA, representing actively translated mRNA, with total RNA in autism spectrum disorder brain tissue.
Methods
The National Center for Biotechnology Information Gene Expression Omnibus and GEO2R were used to identify differentially expressed genes. ShinyGO was then used for Gene Ontology (GO) functional enrichment and Kyoto Encyclopedia of Genes and Genomes (KEGG) pathway enrichment analysis.
The study used GSE236761, which contains messenger RNA data from postmortem brain-derived samples related to autism spectrum disorder. The dataset was analyzed by comparing polysomal RNA with total RNA.
The samples were categorized into two groups: polysomal RNA and total RNA. These groups were compared to identify differences in translation efficiency.
ShinyGO version 0.77 was used to perform functional enrichment analysis, including Gene Ontology and Kyoto Encyclopedia of Genes and Genomes pathway analysis.
Results
Of the 16,302 genes tested, 6,246 genes were significantly differentially expressed using an adjusted probability value below 0.05.
The study selected the top 30 differentially expressed genes based on the largest positive and negative log2 fold changes. These consisted of 15 upregulated genes and 15 downregulated genes
Enrichment analysis identified seven significantly enriched pathways, including systemic lupus erythematosus, alcoholism, neutrophil extracellular trap formation, necroptosis, viral carcinogenesis, sulfur relay system, and sulfur metabolism.
Mitochondrial energy production gene (ATP6) and several histone genes (H2A, H2B, H4) involved in chromatin structure emerged as key disrupted genes, with histone genes shared across multiple enriched pathways linked to chromatin regulation and immune signaling.
Conclusion
The findings suggest that translation efficiency is disrupted in autism spectrum disorder brain tissue and that altered genes are associated with mitochondrial, chromatin-related, and immune-related biological processes. In addition, translational and chromatin-level dysregulation, alongside mitochondrial dysfunction, may be underexplored contributors to autism spectrum disorder.
Identifying these genes and pathways provides potential future targets for biomarker development or therapeutic strategies aimed at correcting mitochondrial or chromatin-related dysfunction in autism.
INTRODUCTION
Autism spectrum disorder (ASD) is a neurodevelopmental condition that affects social communication, behavior, and cognitive function, impacting millions of individuals and families worldwide (1). Despite decades of research, the biological mechanisms underlying ASD remain incompletely understood, and no single genetic or environmental cause fully explains the wide range of symptoms seen across affected individuals. Understanding the molecular basis of ASD matters broadly, since disrupted neurodevelopment carries major impacts on quality of life, learning, and long-term health outcomes for both individuals and families.
Although ASD has a strong genetic component, the specific molecular mechanisms linking ASD-associated genes to cellular dysfunction remain incompletely understood. Most existing gene expression studies of ASD focus only on total mRNA abundance (2), without examining whether that mRNA is actually being translated into protein; a critical downstream step that may reveal disruptions standard expression analysis would otherwise miss.
Is translation efficiency, the process by which mRNA is converted into protein, disrupted in the brains of individuals with autism spectrum disorder, and if so, which specific genes and biological pathways are most affected? Specifically, we compare polysomal RNA (actively translated mRNA) to total RNA in postmortem ASD-affected brain tissue to identify genes and pathways showing significant translational dysregulation (3).
ASD is known to involve disrupted gene expression, altered translation efficiency, and mitochondrial dysfunction. People with ASD have been diagnosed with elevated mitochondrial respiration which was associated with increased sensitivity of the mitochondria to physiological stressors and neurodevelopmental regression (4).
Bioinformatics tools such as GEO2R have been used separately to identify differentially expressed genes in both ASD datasets, using volcano plots and Venn diagrams to visualize significant gene changes within each condition individually (5).
What remains challenging is identifying which specific genes and pathways are most affected by translational, rather than purely transcriptional, dysregulation in ASD, since this regulatory layer has been comparatively understudied relative to standard gene expression analysis.
The goal of this research is to identify which genes and biological pathways show the most significant disruption in translation efficiency in ASD-affected brain tissue.
We hypothesize that a significant number of genes will show a mismatch between total mRNA abundance and polysomal (actively translated) RNA levels in ASD-affected brain tissue, and that genes related to mitochondrial function and chromatin regulation will be disproportionately represented among the most disrupted genes.
This research is important because identifying specific genes and pathways affected by translational dysregulation in ASD-affected brain tissue could provide new insight into how autism disrupts normal cellular function at the protein-synthesis level, and could help point toward future biomarkers or therapeutic targets aimed specifically at correcting translation-level dysfunction rather than gene expression alone.
METHODS
Data Collection and Analysis of GEO2R Data
This research was conducted using the Gene Expression Omnibus (GEO) bioinformatics tool provided by the National Center for Biotechnology Information (NCBI). NCBI GEO2R is a powerful bioinformatic data tool that allows researchers to perform different gene expression analyses of all kinds of datasets stored in GEO. The dataset used, GSE236761, focused on messenger RNA (mRNA) analysis in postmortem brain-derived samples from Autism Spectrum Disorder (ASD) affected individuals, was collected using the keywords “autism spectrum disorder”, and was categorized into groups polysomal RNA and total RNA (7). The dataset was analyzed using the no-code GEO2R bioinformatics tool that uses R programming language.
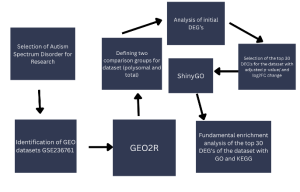
Figure 1: Research Methodology: The steps and bioinformatics used in this study.
To identify the top 30 most significant differentially expressed genes, statistical analysis was applied. To support this selection process, a Venn diagram was utilized to visualize the distribution of significant genes within the dataset. The total list of 16,302 genes generated with the GEO2R database was uploaded into Google Sheets. From this dataset, a total of 6,246 DEGs were identified using an adjusted p-value (Padj) cut-off of less than 0.05, comparing polysomal RNA to total RNA fractions. Genes were further ranked by log2 fold change (log2FoldChange) to prioritize those with the largest magnitude of change. Using these parameters, the study focused on a narrowed list of the top 30 DEGs, selected based on the strongest positive and negative log2FoldChange values, representing genes with the greatest disruption in translational efficiency.
Functional and Enrichment Analysis Using SRPlot, KEGG, and GO Bioinformatics Tools
The ShinyGO bioinformatics tool database was utilized to analyze the functions of the top DEGs identified from each dataset (6). This tool allowed for functional enrichment analysis and provided insights into the biological processes, cellular components, molecular functions, and pathways associated with the selected DEGs, with the ultimate goal of uncovering their potential shared genes between autism spectrum disorder and obstructive sleep apnea. The gene ID symbols were input into the ShinyGO online server, which generated graphical representations including Gene Ontology (GO) enrichment plots (7), KEGG pathway analysis, and network visualizations to summarize the functions of the DEGs and map them to specific biological pathways (8).
RESULTS
Identification of Differentially Expressed Genes
To identify differentially expressed genes GEO2R, the NCBI-based bioinformatics tool built on the R programming language, was used to identify differentially expressed genes in both datasets.
For the autism dataset (GSE236761), comparing polysomal RNA to total RNA revealed 6246 genes with significantly different expression/translation levels. In the volcano plot, each dot represents a single gene. Red dots represent genes that are significantly upregulated, meaning these genes show a higher polysomal to total RNA ratio, indicating their mRNA is being converted into protein more than you’d expect based on how much mRNA exists. Blue dots represent genes that are significantly downregulated, meaning these genes show a lower polysomal-to-total ratio, indicating that a smaller share of their existing mRNA is actively being converted into protein. Both the red and blue dots are statistically significant genes, shown by their adjusted p-values being below 0.05. Black dots represent genes that did not reach statistical significance, meaning any change observed in these genes could not be reliably distinguished from random variation.
For the autism dataset, a total of 16,302 genes were tested. For the autism dataset, 6,246 genes were found to be significantly differentially expressed between polysomal RNA and total RNA (Padj < 0.05).
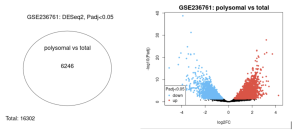
A: Venn diagram showing 6,246 of 16,302 total genes tested were significantly differentially expressed (Padj < 0.05) between polysomal and total RNA.
B: Volcano plot showing genes with significantly higher (red) or lower (blue) polysomal-to-total RNA ratios, indicating altered translational efficiency in ASD brain tissue.
Volcano plot shows a clear mix of significantly upregulated and downregulated genes/probes in both datasets, reflecting substantial transcriptional or translational disruption, while the Venn diagram shows the total count of genes/probes meeting the significance threshold (Padj < 0.05) out of the full gene set tested for each dataset.
Identification of 30)Statistically Significant Differentially Expressed Genes (DEGs)
For the autism dataset GSE236761, we used adjusted p-value (Padj < 0.05) combined with log2FoldChange (log2FC), which measures how much gene expression changes between the two groups of polysomal and total, to narrow down the differentially expressed genes, ranking genes by the magnitude of their log2FC to identify those with the largest shifts in translational efficiency (polysomal vs. total RNA).
For the dataset, we selected the top Top 30 DEGs ranked by the strongest fold change values (both positive and negative) among genes meeting the adjusted p-value significance threshold.
For the autism dataset, the top Top 30 DEGs consisted of 15 upregulated genes (log2FoldChange > 0, translated more efficiently) and 15 downregulated genes (log2FoldChange < 0, translated less efficiently).
Potential Functions and Enrichment of the Identified Genes and/or pathways
To determine the potential functions of the genes ShinyGO 0.77 was used. In the autism dataset, the KEGG pathway analysis identified the Sulfur Relay System as a significantly enriched pathway, showing involvement of genes related to sulfur transfer, tRNA thiolation, and molybdenum cofactor biosynthesis.
In the Systemic Lupus Erythematosus pathway, the genes H2A, H2B, and H4 were highlighted as significantly altered, mapped specifically to the nucleosome-associated genes
Autism:
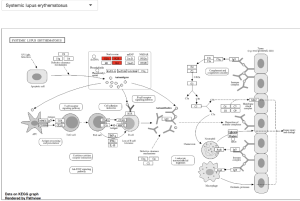
Figure 3: KEGG pathway diagram showing the Systemic Lupus Erythematosus pathway, with the genes H2A, H2B, and H4 highlighted in red, indicating these nucleosome-associated genes were significantly represented among the top DEGs.
For the autism dataset, the enrichment results identified Sulfur relay system, Sulfur metabolism, Systemic lupus erythematosus, Alcoholism, Neutrophil extracellular trap formation, Necroptosis, and Viral carcinogenesis as significantly enriched terms.
In the network diagram, Alcoholism, Neutrophil Extracellular Trap Formation, and Systemic Lupus Erythematosus emerged as the most highly connected nodes, indicating that the genes and immune-related genes in the top DEG list are shared across multiple enriched pathways.
Autism
1: ShinyGO KEGG pathway enrichment plot showing the top 7 enriched pathways among the top 30 DEGs in ASD brain tissue. Bar length represents fold enrichment, dot size represents number of genes per pathway, and dot color represents statistical significance (-log10 FDR), with Systemic lupus erythematosus, Alcoholism, and Neutrophil extracellular trap formation showing the highest statistical significance despite more modest fold enrichment than the sulfur-related pathways.
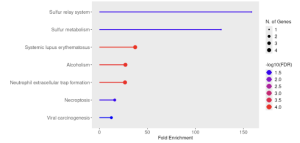
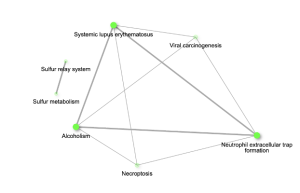
Figure 4: Network diagram showing gene-sharing relationships among the top 7 enriched pathways in the autism dataset. Node size reflects enrichment strength, and connecting line thickness reflects the degree of gene overlap between pathways, with Alcoholism and Neutrophil extracellular trap formation emerging as the most highly connected nodes, linking immune-related and chromatin-regulation pathways.
Table 1: Summary table of Identified Key Genes and Pathways and their Connection to Autism
Key Genes | Gene Name | Enriched Pathway | Function | Autism Connection |
ATP6 | ATP synthase F0 subunit 6 | Oxidative phosphorylation | Core component of mitochondrial ATP synthase; essential for cellular energy (ATP) production | Strongly downregulated at the translational level despite high mRNA abundance, suggesting impaired mitochondrial energy production |
H2A | Histone H2A | Systemic Lupus Erythematosus/ Alcoholism | Core histone protein; wraps DNA to form nucleosomes | Significantly disrupted translation; mapped to nucleosome/autoantigen node, linking chromatin structure to potential immune signaling in ASD |
H2B | Histone H2B | Systemic Lupus Erythematosus/ Alcoholism | Core histone protein; works with H2A, H3, and H4 to package DNA into nucleosomes | Significantly disrupted translation; part of the same chromatin/immune signal as H2A and H4 |
H4 | Histone H4 | Systemic Lupus Erythematosus/ Alcoholism | Core histone protein; critical for nucleosome stability and chromatin compaction | Significantly disrupted translation; consistently flagged across chromatin- and immune-related pathways |
DISCUSSION
Summary of Findings
This study aimed to determine whether translation efficiency is disrupted in the brains of individuals with autism spectrum disorder (ASD), and to identify which specific genes and biological pathways are most affected. Using GEO2R analysis of the GSE236761 dataset, comparing polysomal RNA to total RNA in ASD-affected postmortem brain tissue, 6,246 of 16,302 genes tested (Padj < 0.05) were found to be significantly differentially expressed. From this list, the top 30 DEGs were identified, consisting of 15 upregulated and 15 downregulated genes, ranked by log2FoldChange. KEGG pathway analysis identified the Systemic Lupus Erythematosus pathway as significantly enriched, with the genes H2A, H2B, and H4 highlighted, mapped specifically to the nucleosome part of the pathway. Broader GO/KEGG enrichment results also identified Alcoholism, Neutrophil extracellular trap formation, Necroptosis, and Viral Carcinogenesis as significantly enriched terms, with Alcoholism and Neutrophil extracellular trap formation emerging as the most highly connected nodes in network analysis.
Interpretation of Results
The large number of significantly differentially expressed genes (6,246) indicates that translation efficiency is significantly disrupted in ASD-affected brain tissue, meaning many genes’ mRNA levels do not accurately predict how much protein is actually being produced. Among the top DEGs, the mitochondrial gene ATP6 showed strong translational suppression despite very high total mRNA abundance, suggesting that mitochondrial energy production may be impaired at the protein synthesis level in ASD, consistent with our hypothesis. The enrichment of genes across multiple KEGG pathways, including the Alcoholism (a pathway built around genes involved in chromatin remodeling) and Systemic Lupus Erythematosus pathways (a pathway mapping out how the immune system reacts to nucleosomes, DNA wrapped around proteins, when they’re released from damaged or dying cells), supports our hypothesis that chromatin regulation would be disproportionately represented among disrupted genes.
Comparison with Previous Studies
Our findings match what other scientists have already found about autism. One study looked at 204 different research papers and found that people with autism often have problems with their mitochondria including unusual levels of things like ATP and lactate (9). This backs up what we found with the ATP6 gene, which showed signs of being under-translated in our data. The genes we found also line up with other autism research showing that how DNA gets packaged and controlled plays a role in the disorder, including DNA methylation changes in the brain (10). A separate study looking at brain tissue from children who died from autism-related causes also found significant DNA methylation differences in a brain region tied to mood and behavior, further supporting the idea that how DNA is packaged and controlled is commonly disrupted in autism (11)
Implications and Limitation
These findings suggest that translation-level dysregulation, rather than gene transcription alone, may be an important and underexplored contributor to the molecular basis of autism spectrum disorder. Identifying specific disrupted genes such as ATP6 and key genes could help point toward future biomarkers for early detection or subtyping of ASD based on underlying molecular mechanisms. If mitochondrial and chromatin-related translational dysfunction is confirmed through further study, these pathways could eventually become targets for therapeutic intervention.
Because this study relies on a publicly available bioinformatics dataset generated by other researchers rather than original laboratory data, any genes identified as significant would need to be validated through direct laboratory experimentation or clinical study before their biological role in autism could be confirmed. Additionally, the dataset included a small number of postmortem brain donors, limiting the generalizability of these findings to the broader ASD population, and the analysis did not include a direct comparison to neurotypical control samples, meaning it cannot be determined whether the observed translational patterns are unique to ASD or also present in typical brain tissue.
Future Directions
The genes identified in this study, particularly ATP6 and the genes H1-2, H1-4, H2A, H2B, and H4, could be tested in laboratory settings to determine whether their disrupted translation directly contributes to mitochondrial dysfunction or altered chromatin structure in neuron cells. Future studies could also directly compare polysomal-to-total RNA ratios between ASD and neurotypical control samples to confirm whether this translational disruption is specific to autism.
References
- Lord C, Elsabbagh M, Baird G, Veenstra-Vanderweele J. Autism spectrum disorder. Lancet. 2018 Aug 11;392(10146):508-520. doi: 10.1016/S0140-6736(18)31129-2.
- Engal E, Zhang Z, Geminder O, Jaffe-Herman S, Kay G, Ben-Hur A, Salton M. The spectrum of pre-mRNA splicing in autism. Wiley Interdiscip Rev RNA. 2024;15(2):e1838. doi: 10.1002/wrna.1838.
- Aksoylu IS, Martin P, Robert F, Szkop KJ, Redmond NE, Chen S, Beauchamp RL, Nobeli I, Pelletier J, Larsson O, Ramesh V. Translatome analysis in postmortem brain-derived samples from Autism Spectrum Disorder affected individuals. Gene Expression Omnibus. GSE236761.
- Frye RE, Rincon N, McCarty PJ, Brister D, Scheck AC, Rossignol DA. Biomarkers of mitochondrial dysfunction in autism spectrum disorder: A systematic review and meta-analysis. Neurobiol Dis. 2024 Jul;197:106520. doi: 10.1016/j.nbd.2024.106520. PMID: 38703861.
- Clough E, Barrett T, Wilhite SE, Ledoux P, Evangelista C, Kim IF, Tomashevsky M, Marshall KA, Phillippy KH, Sherman PM, Lee H, Zhang N, Serova N, Wagner L, Zalunin V, Kochergin A, Soboleva A. NCBI GEO: archive for gene expression and epigenomics data sets: 23-year update. Nucleic Acids Res. 2023. doi: 10.1093/nar/gkad965.
- Ge SX, Jung D, Yao R. ShinyGO: a graphical gene-set enrichment tool for animals and plants. Bioinformatics. 2020;36(8):2628-2629. doi: 10.1093/bioinformatics/btz931.
- Gene Ontology Consortium. The Gene Ontology (GO) database and informatics resource. Nucleic Acids Res. 2004;32(suppl_1):D258-D261. doi: 10.1093/nar/gkh036.
- Kanehisa M, Araki M, Goto S, Hattori M, Hirakawa M, Itoh M, Katayama T, Kawashima S, Okuda S, Tokimatsu T, Yamanishi Y. KEGG for linking genomes to life and the environment. Nucleic Acids Res. 2008;36(suppl_1):D480-D484. doi: 10.1093/nar/gkm882.
- Frye RE, Rincon N, McCarty PJ, Brister D, Scheck AC, Rossignol DA. Biomarkers of mitochondrial dysfunction in autism spectrum disorder: A systematic review and meta-analysis. Neurobiol Dis. 2024 Jul;197:106520. doi: 10.1016/j.nbd.2024.106520. PMID: 38703861.
- Iwata K, Nakabayashi K, Ishiwata K, Nakamura K, et al. Genome-wide DNA methylation profiles in the raphe nuclei of patients with autism spectrum disorder. Psychiatry Clin Neurosci. 2025 Jul;79(7):415-424. PMID: 40272067.
- Iwata K, Nakabayashi K, Ishiwata K, Nakamura K, et al. Genome-wide DNA methylation profiles in the raphe nuclei of patients with autism spectrum disorder. Psychiatry Clin Neurosci. 2025 Jul;79(7):415-424. PMID: 40272067.


