Using Bioinformatics Tools to Analyze the Differentially Expressed Genes of Treated Triple-Negative Breast Cancer Cells

ABSTRACT
Background
Breast cancer is a global disease that affects millions of women (those assigned female at birth) around the world. It is caused by the build-up of cancerous cells in the breast, which can be due to a number of factors, including radiation, genetic mutations, and oestrogens. Specifically, the cause of Triple-Negative Breast Cancer (TBNC), a subtype of breast cancer with a low survival rate, remains unclear to many scientists. To fill this research gap, this study further explored the effects of optimal medication trials on differentially expressed genes of Triple-Negative Breast Cancer cells.
Methods
This study used various bioinformatics tools and databases, namely, NCBI GEO, SR Plot, GO, and KEGG. First, the GEO bioinformatics database was used to find and collect data from GEO Dataset ID GSE264630, which focuses on paclitaxel-resistant triple negative breast cancer cells treated with various medications including DMSO and LLY283. The dataset was then divided into three groups based on these different treatment plans: a control group, the DMSO group, and the LLY283 group. A GEO2R analysis of this dataset resulted in thousands of differentially expressed genes (DEGs) that were narrowed down to the top 40 DEGs based on the lowest p-values. Finally, to determine the functions and associated biological pathways of the top 40 DEGs, SR Plot bioinformatics tool was used to perform gene ontology (GO) and KEGG pathway analyses.
Results
GEO2R analysis of the GEO dataset resulted in a total of 26,567 genes. Among these genes, 42 were differentially expressed (DEGs) between all the groups. The 40 top DEGs were narrowed down using the lowest p-values. Some enriched gene ontology terms after the GO analysis included eicosanoid receptor activity, G protein-coupled peptide receptor activity, peptide receptor activity, and protein-ADP ribosylase activity. Enriched KEGG pathways included neuroactive ligand-receptor interaction, alpha linoleic acid metabolism, and linoleic acid metabolism. Top common genes included LTB4R, LTB4R2, PARP12, PLAG12, and HTT.
Conclusion
Looking specifically at the molecular function of the top genes, such as LTB4R, LTB4R2, PARP12, and PLAG12, all play different roles in cancer. Some act as tumor suppressors while others act as inhibitors of biomarkers in cancer cells. Expression of these genes in the TBNC samples can reveal the effectiveness of the specified treatments.
INTRODUCTION
Breast cancer is the leading type of cancer that impacts 12% of women in the United States. Around 2.089 million women were diagnosed with breast cancer in 2018 and cases continue to rise (Smolarz, Beata, et al., 2022). At its core, breast cancer forms from a collection of cells that turn cancerous and build up to form tumors or masses. Some risk factors include oestrogens, late menopause, and high concentrations of endogenous oestradiol (Key, Timothy J, et al., 2001). Approximately 90% of breast cancer cases in women are caused by gene alterations obtained during their lifetimes. Among many gene mutations, key alterations that form in cancer cells are in the tumor suppressor genes (BRCA genes) and proto-oncogenes (Advanced Journal of Chemistry). Breast cancer is subcategorized into three main types based on the molecular markers for estrogen or progesterone receptors and human epidermal growth factor 2 (ERBB2). This includes HER2 negative, HER2 positive, and triple-negative, which indicates the lack of all three standard molecular markers in the tumor cells. This research study focuses on the latter, triple-negative blood cancer (TBNC) (Breast Cancer Treatment 2), which constitutes fifteen to twenty percent of breast cancers. Those diagnosed with TNBC typically live for around one year. (Smolarz, Beata, et al., 2022).
In the past, researchers have used GEO databases as a way to find key biomarkers for breast cancer. In one particular study, ten Hub genes were identified (PBK, CCNA2, CDCA8, MELK, NUSAP1, BIRC5, CCNB2, HMMR, MAD2L1, and PRC1) that are overexpressed in cancerous tissue, specifically from an individual with triple-negative breast cancer (Yang, Kaidi, et al., 2019). The critical roles these differentially expressed genes play can allow for earlier detection of breast cancer.
One challenge of Triple-Negative Breast Cancer is that it remains extremely hard to treat due to the lack of estrogen receptors and HER2 amplification targets. Therefore, scientists are currently working on creating personalized treatments for patients by focusing on the biomarkers present rather than the three molecular markers it lacks (Leon-Ferre, Roberto A, et al., 2023). Some limitations the science community still faces is creating targeted therapies without the target receptors, like estrogen, progesterone, and HER, present. Triple-negative blood cancer or TBNC is highly heterogeneous, meaning that it has multiple subtypes with multiple molecular profiles. The heterogeneity of this cancer requires deep research to formulate more helpful treatments for patients (Obidiro, Onyinyechi, et al., 2023). Some promising approaches include targeting cancer energy metabolism and targeting protein to protein signaling. These approaches can be used by researchers to find novel therapeutics (Chapdelaine et al., 2023). This research aims to bridge this gap by using bioinformatics to contribute to finding more novel therapeutics.
The goal of this research is to identify differentially expressed genes within a GEO dataset and determine the potential functions and biological pathways they are associated with as potential targets for novel therapeutics. It is hypothesized that there will be a significant difference between gene expression in the control group, DMSO group, and the LLY283 group because various treatments have been added to the samples. For more context, DMSO or dimethyl sulfoxide is a pharmaceutical solvent for cell therapies (Hoang, Ba X et al., 2023). LLY283 is a drug used for antitumor purposes as a inhibitor of protein arginine methyltransferase 5 (PRMT5) (Feustel, et al., 2022). The dataset used in this study focuses on the role of PRMT5 inhibitors and other anticancer agents on paclitaxel-resistant triple negative breast cancer cells. The information can be used to further compare the effects of various medications on triple-negative breast cancer cells.
As mentioned previously, triple-negative breast cancer is a difficult type of cancer to cure. With 13 in every 100,000 women in the United States being diagnosed (Triple-Negative Breast Cancer: Facts and Stats), it is important that this specific type of breast cancer is further explored. Currently, there are not many personalized medication plans that work on triple-negative breast cancer. For that reason, this research will contribute to important differentially expressed genes that can point towards optimal medication to target the cancer cells effectively.
METHODS
Data Collection
The overall workflow of the research is summarized in Figure 1. First, using the NCBI GEO dataset, we identified a fitting dataset on triple-negative breast cancer. NCBI is a website created by researchers and programmers to organize public databases of genes, transcripts, and proteins (http://ncbi.nlm.nih.gov). It provides standard reference sequences and descriptions of different genes (Pruitt, Kim D, et al., 2024). The data set GSE264630 was chosen, whose primary research specifically focused on paclitaxel-resistant triple breast cancer. Paclitaxel is a well known anticancer agent that inhibits tumor growth through the blockage of cell division in the G2 and M phase (Xu, Xiangwei, et al., 2022). Epigenetic chemical probe screen data uncovered that these resistant cancer cells are vulnerable to inhibition of protein arginine methyltransferases (PRMTs) through cell division stabilizing. PRMT5 is known to promote tumor cell growth early on in the diagnosis (Shailesh, Harshita et al., 2018). For this dataset, researchers conducted RNA-sequencing on the paclitaxel-resistant cells with PRMT5 inhibitors including LLY283 and GSK591.
Defining Groups
In order to analyze this dataset, the GEO2R bioinformatics tool was used. This bioinformatics tool allows individuals to compare two or more groups in the Gene Expression Omnibus (GEO) series in order to identify patterns in expressed genes and produce analytical graphs (Clough et al., 2016). Groups were assigned based on the treatment type applied to the cancerous cell. Of the samples given, 2 samples were defined as controls, 10 samples were defined as the LLY283 group, and 8 samples were defined as the DMSO group. To reiterate, DMSO is an anticancer drug that inhibits tumor proliferation (Villarroel, Ariana, et al., 2020). Since it is not one of the treatments that act as PRMT5 inhibitors, it will act as a second control for parts of the analysis. LLY283, an inhibitor for the PRMT5 protein, is the treatment for the experimental group. It was decided not to include GSK591 in the analysis as it had less correlation with the other data and thus could obscure trends. Once the groups were defined, they were analyzed through GEO2R. This resulted in statistical analysis compiled into graphs and tables as well as a list of the top differentially expressed genes within the dataset. These results were generated using the R programming language with pre-programmed AI and ML algorithms (R-script of GEO Dataset).
Narrowing down the Top Differentially Expressed Genes
It is crucial to narrow down the list of top DEGs before putting it into another bioinformatics tool, such as SR plot (www.bioinformatics.com.cn/srplot). To do this, the raw list of genes in the dataset and their accompanying information was downloaded into a Google Sheet. The data came with associated p-values, which are important because they describe the probability of the results happening by chance. Therefore, for data to be more significant, the p-value needs to be low. The list of DEGs was narrowed down to the 40 genes that had the lowest p-values (ranging from 2.37E-21 to 2.95E-08) (DEGs for Breast Cancer Study).
Using SR plot Bioinformatics Tool for Gene Ontology Analysis and KEGG Pathway
Once the list was narrowed down to the top 40 (DEGs for Breast Cancer Study), it was inputted into a bioinformatics tool called SR plot. SR plot is a free online bioinformatics platform used for data collection and visualization pertaining to enrichment and functional analysis (Tang, Doudou, et al., 2023). In SR plot, the data was analyzed through the GEO pathway enrichment analysis for Gene Ontology Analysis and KEGG pathway. Gene Ontology is a bioinformatics tool used to categorize genes into different groups based on their description/function (“Gene Ontology Overview.”). The three independent branches are descriptions of the genes’ molecular function (MF), their location in cellular components (CC), and biological processes (BP) they contribute to (Dameron, O., Bettembourg, C., Meur, N. L.). Similarly, the KEGG pathway is a bioinformatics collection of databases with genomes, biological pathways, diseases, drugs, and substances from the Kyoto Encyclopedia of Genes/Genomes that depict diagrams of processes like metabolic and signaling pathways (Kegg Pathway Map).
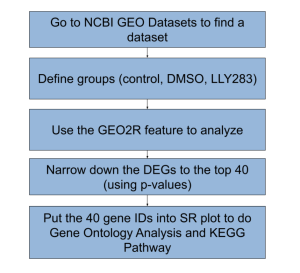
Figure 1. Summary of method steps used in this study. Various bioinformatics databases and tools were used in this study. NCBI GEO was used to collect data and identify differentially expressed genes. SR Plot was used to determine the potential gene functions and associated biological pathways of the key top DEGs.
RESULTS
Differences and similarities between the top DEGs from the GEO2R Bioinformatics Tool on NCBI
In this study, GEO2R was implemented to highlight the top differentially expressed genes. Differentially expressed genes (DEGs) are genes that show a statistically significant change in expression levels, typically measured by mRNA or protein production in microarrays, in response to varying experimental conditions such as time, temperature, disease state, tissue location, and other factors. R-script programming pre-programmed by AI and ML was used to identify top DEGs using GEO2R bioinformatics tools. The R-script used in this study is linked here: R-script of GEO Dataset
Results in Figure 2 depicts volcano plots showing relationships between the top differentially expressed genes across the groups. Each dot represents a gene that is expressed differently between treatment and control groups. The red dots indicate genes that are upregulated and the blue dots indicate genes that are downregulated when compared with the control. Gray dots are genes that were expressed the same in both groups.
Between the control group and DMSO, 2,080 DEGs were upregulated and 3,257 DEGs were downregulated from a total of 5,337 DEGs (Figure 2a). Between the DMSO and LLY283 group, 161 DEGs were upregulated and 391 DEGs were downregulated from a total of 552 DEGs (Figure 2b). Between LLY283 and control, 31 DEGs were upregulated and 3 DEGs were downregulated from a total of 34 DEGs (Figure 2c). The overlapping Venn Diagram (Figure 3) shows common significant genes amongst the different groups with 42 common genes among all the three groups (control, DMSO, and LLY283). There are a total of 26,567 DEGs in total.
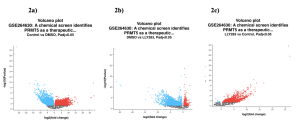
Figure 2. Volcano plots compare the expression of genes between two specific treatment/control groups. Red signifies upregulation and blue signifies downregulation.
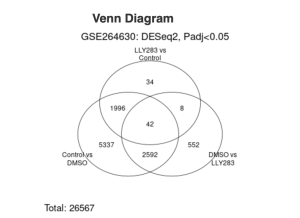
Figure 3. The Venn Diagram describes the common significant genes between the different treatment groups.
Top 40 DEGs analyzed using SR plot Gene Ontology Analysis
The GO results reveal increased enrichment of biological processes, specifically the positive regulation of calcium-mediated signaling, and molecular function, specifically icosanoid receptor activity (Figure 4). Since the molecular function enrichment score is the only one above 3, it will be focused on in this study. Figure 5 connects significant MF genes with related functions. Gene PARP12 connects to protein- ADP ribosylase activity. Gene PLA2G12A is associated with calcium-dependent phospholipase A2 activity. Gene GSTM4 is related to carbon-sulfur lyase activity, oligopeptide binding, and glutathione binding. Gene HTT is associated with profilin binding and dynactin binding. Gene LTB4R is connected to icosanoid activity, G protein-coupled peptide receptor activity, and peptide receptor activity. Gene LTB4R2 is connected to G protein-coupled peptide receptor activity and peptide receptor activity.
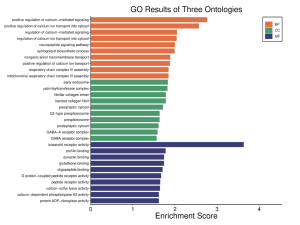
Figure 4. Biological process (BP), cellular component (CC), and molecular function (MF) are the three ontologies on this graph. It shows that the top 40 DEGs are the most enriched in BP and MF . The enrichment score threshold was 3 or above.
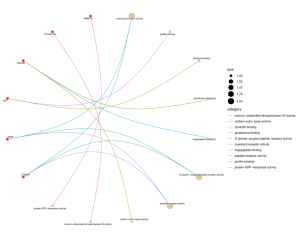
Figure 5. Cnet plot that connects key genes and their relation to significant activities and functions. This plot focuses specifically on molecular function. Gene PARP12: protein- ADP ribosylase activity. Gene PLA2G12A: calcium-dependent phospholipase A2 activity. Gene GSTM4: carbon-sulfur lyase activity, oligopeptide binding, and glutathione binding. Gene HTT: profilin binding and dynactin binding. Gene LTB4R: icosanoid activity, G protein-coupled peptide receptor activity, and peptide receptor activity. Gene LTB4R2: G protein-coupled peptide receptor activity and peptide receptor activity.
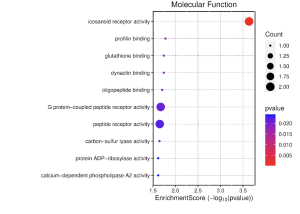
Figure 6. In this dot plot on molecular function ontology, blue/purple dots indicate insignificant data due to the high p-value, while big, red dots are considered the most significant. Icosanoid receptor activity is the only significant molecular function that is enriched in the top 40 DEGs.
KEGG Pathway of Top 40 DEGs
Figure 7 shows that the most enriched pathways are neuroactive ligand-receptor interaction, alpha-linolenic acid metabolism, and linoleic acid metabolism. Among the three pathways, neuroactive ligand-receptor interaction is the most enriched with an enrichment score of around 2 (Figure 9). As seen in Figure 8, the main genes involved in the neuroactive ligand-receptor interaction are LTB4R and GABR.
Specific Gene Analysis through GEO2R
Figures 10, 11, and 12 are all detailed charts on the expression of one particular gene in the different experimental groups. PLA2G12A is expressed lower in the control group as well as the LLY283 group and the highest in the DMSO group. The highest expression value is around 27 in the DMSO group and the lowest expression value is 5 in the LLY283 group (Figure 10). From the lowest expression of GSTM4 to the highest expression of GSTM4, the groups are control, LLY283, and DMSO. The highest expression value is around 24.5 in the DMSO group and the lowest expression value is 5 in the control group and LLY283 group (Figure 11). Figure 12 describes the expression of both LTB4R and LTB4R2. In both cases, DMSO samples have the lowest expression of the gene and LLY283 groups have the highest. The highest expression value is 12 and the lowest is 1 (Figure 12a).
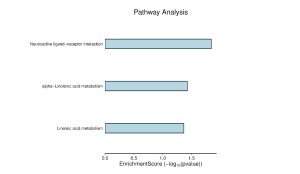
Figure 7. The top 40 DEGs are most enriched in neuroactive ligand-receptor interaction.
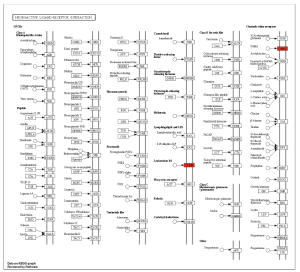
Figure 8. Pathway enrichment diagram of neuroactive ligand-receptor interaction dealing with specific genes like LTB4R and GABR.
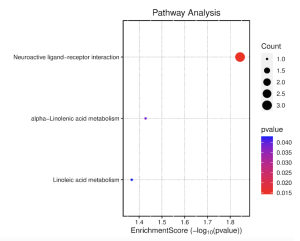
Figure 9: Neuroactive ligand-receptor interaction most highly enriched in the top 40 DEGs. The red dots are considered significant while purple/blue are insignificant.
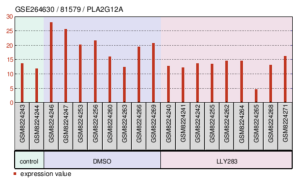
Figure 10. Expression levels of gene PLA2G12A in the samples of the GEO Dataset.
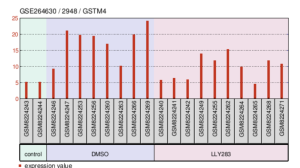
Figure 11. Expression levels of gene GSMT4 in the samples of the GEO Dataset.
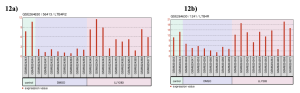
Figure 12. Expression levels of gene LTB4R and LTB4R2 in the samples of the GEO Dataset.
Supplementary Materials
R Script: R script Used to Generate GEO2R Results
Top DEGs: DEGs for Breast Cancer Study
DISCUSSION
The main goal of this study is to identify top differentially expressed genes that are enriched in the samples of the GEO dataset, GSE264630. Through GEO2R analysis and SR plot gene enrichment analysis, we narrowed down the top 40 DEGs to less than 10 genes that were significant in the samples. Gene ontology revealed the enrichment of molecular function, specifically with the genes LTB4R, LTB4R2, PARP12, GSTM4, PLA2G12A, and HTT. Further research into these genes and their related pathways allowed for a further refinement of top genes.
PARP12 is a tumor suppressor gene that interacts with FHL2, which is one of its functional partners. Through a study performed by Shao et.al, PARP12 deficiency correlates to a decrease in FHL2 levels, which promotes the migration and infiltration of hepatocellular carcinoma (Shao, Changjuan, et al., 2018). It is related to protein-ADP ribosylation activity as a member of the ADP-ribosyl transferase family. PARP12 works by blocking mRNA translation, typically during DNA correction, in order to suppress mutations. Therefore, it can also work as a cellular defense against viral infections (Welsby, lain, et al., 2014). Current research articles find no direct linkage between PARP12 and a specific type of cancer (Scarpa, Emanuele S., et al., 2013). However, as the data from Figure 5 suggests, PARP12 does carry a linkage and correlation to breast cancer.
PLA2G12A is another prominent gene in this study. Although there are mixed conclusions from other studies on this gene, some articles correlate this gene with protection against diet-induced obesity and insulin resistance (Wu, Min, et al., 2024). In addition, the connected calcium-dependent phospholipase A2 activity has functions in relation to neurotransmission and inflammatory signaling (Wang, Shaowei et al., 2022). However, on a less specific level, phospholipase A2 activity, which involves hydrolyzing of phospholipids and releasing of fatty acids and lysophospholipids, plays a role in colorectal cancer. Lower expression of PLA2G12A in this study led to tumor growth and recurrence (Parisi, Eva et al., 2023). Figure 10 shows the lower expression of the gene in the control group, which is the untreated cancer cell, and the higher expression of the gene in the treatment groups. Since deficiency means greater tumor growth, the graph shows the treatment plans working, especially DMSO as the anticancer agent. Compared to LLY283 samples, DMSO samples had drastically higher levels of PLA2G12A, meaning less tumor growth overall.
Past studies indicate a strong association between GSMT4 and a type of bone cancer called Ewing’s sarcoma. This gene creates proteins that play an important role in drug resistance. Lowered amounts of GSTM4 result in an increased susceptibility of the cancer cells to anticancer agents (Luo, W et al., 2009). Figure 5 shows an association of carbon-sulfur lyase activity, oligopeptide binding, and glutathione binding to GSTM4. Carbon-sulfur lyase activity, which is defined as the act of an enzyme that breaks a carbon-sulfur bond, does not have much relation to activities of GSTM4 in regards to cancer (“Carbon-Sulfur Lyases-Mesh-NCBI”). Oligopeptide binding is the binding of the oligopeptide ligand to αvβ3 integrin receptor. This receptor is overexpressed in tumor cells, so the binding of a ligand to this receptor can increase the effectiveness of treatment plans and can also reduce possible side effects (“Oligopeptide.”). Lastly, glutathione is involved with controlling cell differentiation, proliferation, and apoptosis. Mutations or an increase in glutathione expression is linked to tumor growth (Kennedy, Luke et al., 2020). Figure 11 shows the approximate levels of GSTM4 genes in the different types of sample in the GEO Dataset. Based on these results, the control has lower levels, LLY283 has medium levels, and DMSO has high levels of GSTM4. This contradicts studies that state that lower levels of GSTM4 typically correlates with effective treatment plans (Luo, W et al., 2009). If this were the case, then the treatment groups, LLY283 and DMSO would have the lower levels of GSTM4. However, it must be noted that the correlation between GSTM4 and cancer was mentioned with Ewing’s sarcoma cells and not breast cancer cells (Luo, W et al., 2009).
Figure 5 indicates the importance of the HTT gene, but there is no direct linkage between this gene and cancer. HTT is a disease connected to Huntington’s disease, which is a neurodegenerative disorder (“HTT Huntington”). However, a study describes a possible unexpected association of HTT and mutant HTT to tumor growth (Thion, Morgane Sonia, et al., 2018). Interestingly, the mutated HTT gene in Huntington’s disease patients creates molecules toxic to cancer cells and thus leads to 80% less chance of cancer than the normal population (Shanley, Mathew, 2021). Profilin binding has a role in cell functions and the cell cycle. It is said to be dysregulated in types of cancer, making it a key biomarker (Thione et al., 2018). Dynactin binding regulates oncogene expression (Izdebska, Magdalena et al., 2020). However, there is no indication of whether the HTT gene is mutated or not in the GEO Dataset and therefore, there is very little clear association between HTT and cancer cells treated with different anticancer agents.
Lastly, LTB4R and LTB4R2 carry important significance in the samples and therefore breast cancer cells. LTB4R and LTB4R2 are leukotrienes B4 receptors 1 and 2 that promote metastasis or cell growth and are involved in tumor development. An earlier study found that TNBC cells have a lower survival rate in LTB4R expression groups (Kalinkin, A.l., et al., 2019). LTB4R and LTB4R2 associated pathways include eicosanoid activity, G protein-coupled peptide receptor activity, and peptide receptor activity. Eicosanoid is especially significant due to its mention in Figure 4 and Figure 6 in addition to Figure 5. Eicosanoid is a signal molecule that consists of many essential elements including leukotriene, which is a primary part of LTB4R. It plays a role in cell differentiation and cell growth, two big parts of cancer (“Eicosanoid.”). As eicosanoids are elevated in patients with tumors, eicosanoid receptors are appealing therapeutics to work as anticancer agents (Johnson, Amber M., et al., 2020). Like eicosanoids, g-protein coupled receptors (GPCRs), which is a type of peptide receptor, play a role in cell proliferation and tumor metastasis. Overexpression of GPCRs leads to rapid tumor growth (Dorsam, et al., 2007). Interestingly, the control group and LLY283 group had drastically higher expressions of LTB4R and LTB4R2 compared to the DMSO group (Figure 12). Moreover, since higher LTB4R/2 expression indicates greater tumor development, the DMSO group seems to be the optimal treatment plan to most effectively combat this form of cancer.
Table 1. Top differentially expressed genes in the samples that are highly enriched and significant.
Gene | Function | Connection |
|---|---|---|
LTB4R/LTB4R2 | Promotes cell survival and proliferation (icosanoid activity) | Major role in tumor development |
PARP12 | Tumor suppressor gene to fight infections | Protein-ADP riboslyase activity correlated directly with mitosis in cancer |
PLA2G12A | Phospholipase A2 Activity | Prognostic Biomarker seen in Colorectal Cancer |
A lot of the information gathered from this study supports existing knowledge found in primary research articles. In a study of PLAG12A in colorectal cancer, lower expression of the gene led to greater tumor growth of cancer cells (Parisi, Eva et al., 2023). In the GEO Dataset data analyzed in this study, Figure 10 shows the low expression of PLAG12A in the control group. This corroborates the existing study as the control includes uncured TNBC cells, meaning greater tumor growth. This correlation between the two studies indicates the relevance of PLAG12A in not only colorectal cancer, but triple-negative breast cancer as well.
The study found that LTB4R, LTB4R2, PARP12, and PLA2G12A are top differentially expressed genes that play a significant role in TNBC. Evaluating expressions of these genes in cancer cells can provide researchers with accurate biomarkers to assess the stage and intensity of the cancer. Inhibitors of these genes, like oligopeptide binding related to GSTM4, can be explored as potential novel therapeutics to combat the growth of tumors in the breast.
A potential limitation to the information presented in this study is attributed to the strict use of bioinformatic datasets from other researchers through RNA-sequencing methods. The top identified genes will need to be further analyzed for understanding their intricate roles in cancer. Another key limitation was the amount of samples in the groups of the GEO Dataset. There were only two control samples given as opposed to 8 samples of the DMSO treatment and 10 of the LLY283 treatment. The imbalance of samples could potentially play a role in skewing the results.
In the future, the four main genes, LTB4R, LTB4R2, PARP12, and PLAG12A, can be tested in the lab on sample cancer cells with different controls to further identify the roles they play. In addition, more research needs to be done on HTT and its unexpected relationship to breast cancer. The HTT gene found in the samples needs to be tested to see whether it is referring to the mutant HTT gene or the wild type one in order to understand its relevance to the negative effects of cancer.
Conclusion
Over 26,000 genes from the GEO Dataset samples were narrowed down to the top 40 differentially expressed genes. These top 40 were further refined through gene ontology and KEGG pathway to four main genes: LTB4R, LTB4R2, PARP12, and PLAG12A. These significant genes play important roles in cell differentiation, mitosis, and cell proliferation of tumor cells.
The research conducted to identify the difference in expression of genes between the cancer cells and the treated cancer cells was depicted through GEO expression results of the aforementioned four genes. These results showed the differences in amounts of each gene in the samples per group, indicating the effectiveness of each treatment plan. The study’s hypothesis was that there will be a difference between gene expression in the control group, DMSO group, and the LLY283 group, which will allow us to compare the effects of different treatments on triple-negative breast cancer cells. As hypothesized, the results showed clear distinction between gene expression levels based on cancer cell growth in comparison to cancer cells receiving treatment. Further research studies should focus on testing these top four genes in the lab and investigating the exact relationship between the HTT gene, a gene primarily involved in Hunington’s disease and breast cancer.
References
- Advanced Journal of Chemistry, Section B: Natural Products and Medical Chemistry – Editorial Board, www.ajchem-b.com/journal/editorial.board. Accessed 23 July 2024.
- “Carbon-Sulfur Lyases – Mesh – NCBI.” National Center for Biotechnology Information, U.S. National Library of Medicine, www.ncbi.nlm.nih.gov/mesh?Db=mesh&Cmd=DetailsSearch&Term=%22Carbon-Sulfur%2BLyases%22%5BMeSH%2BTerms%5D#:~:text=Enzymes%20that%20catalyze%20the%20cleavage,other%20than%20hydrolysis%20or%20oxidation. Accessed 5 Aug. 2024.
- Chapdelaine, Abygail G., and Gongqin Sun. “Challenges and opportunities in developing targeted therapies for triple negative breast cancer.” Biomolecules, vol. 13, no. 8, 1 Aug. 2023, p. 1207, https://doi.org/10.3390/biom13081207.
- Clough, Emily, and Tanya Barrett. “The Gene Expression Omnibus Database.” SpringerLink, Springer New York, 2016, link.springer.com/protocol/10.1007/978-1-4939-3578-9_5.
- Dameron, O., Bettembourg, C., & Meur, N. L. (n.d.). Measuring the evolution of ontology complexity: The gene ontology case study. PLOS ONE. https://journals.plos.org/plosone/article?id=10.1371%2Fjournal.pone.0075993
- Dorsam, Robert T., and J. Silvio Gutkind. “G-protein-coupled receptors and cancer.” Nature Reviews Cancer, vol. 7, no. 2, Feb. 2007, pp. 79–94, https://doi.org/10.1038/nrc2069.
- “Eicosanoid.” Eicosanoid – an Overview | ScienceDirect Topics, www.sciencedirect.com/topics/neuroscience/eicosanoid#:~:text=Eicosanoids%20have%20important%20significant%20role,et%20al.%2C%202021). Accessed 5 Aug. 2024.
- Feustel, Kavanya, and Gerald S. Falchook. “Protein arginine methyltransferase 5 (PRMT5) inhibitors in oncology clinical trials: A Review.” Journal of Immunotherapy and Precision Oncology, vol. 5, no. 3, 22 June 2022, pp. 58–67, https://doi.org/10.36401/jipo-22-1.
- “Gene Ontology Overview.” Gene Ontology Resource, 11 July 2024, geneontology.org/docs/ontology-documentation/#:~:text=The%20Gene%20Ontology%20(GO)%20describes,catalysis%E2%80%9D%20or%20%E2%80%9Ctransport%E2%80%9D.
- Hoang, Ba X et al. “The Rationality of Implementation of Dimethyl Sulfoxide as Differentiation-inducing Agent in Cancer Therapy.” Cancer diagnosis & prognosis vol. 3,1 1-8. 3 Jan. 2023, doi:10.21873/cdp.10172
- “HTT Huntingtin [Homo Sapiens (Human)] – Gene – NCBI.” National Center for Biotechnology Information, U.S. National Library of Medicine, www.ncbi.nlm.nih.gov/gene/3064#:~:text=Studies%20indicate%20that%20mutant%20Huntingtin,poor%20prognosis%20and%20metastasis%20development. Accessed 5 Aug. 2024.
- Izdebska, Magdalena et al. “Involvement of Actin and Actin-Binding Proteins in Carcinogenesis.” Cells vol. 9,10 2245. 6 Oct. 2020, doi:10.3390/cells9102245
- Johnson, Amber M., et al. “Eicosanoids in cancer: New roles in immunoregulation.” Frontiers in Pharmacology, vol. 11, 18 Nov. 2020, https://doi.org/10.3389/fphar.2020.595498.
- Kalinkin, A.I., et al. “Leukotriene B4 receptors abnormal gene expression is associated with either shorter or longer survival in breast cancer patients depending on the intrinsic tumour molecular subtype.” Annals of Oncology, vol. 30, Nov. 2019, p. vii17, https://doi.org/10.1093/annonc/mdz413.061.
- Kegg Pathway Map (HELP), www.genome.jp/kegg/document/help_pathway.html#:~:text=The%20KEGG%20PATHWAY%20database%20is,pathways%20associated%20with%20human%20diseases. Accessed 5 Aug. 2024.
- Kennedy, Luke et al. “Role of Glutathione in Cancer: From Mechanisms to Therapies.” Biomolecules vol. 10,10 1429. 9 Oct. 2020, doi:10.3390/biom10101429
- Key, Timothy J, et al. “Epidemiology of Breast Cancer.” The Lancet Oncology, vol. 2, no. 3, Mar. 2001, pp. 133–140, https://doi.org/10.1016/s1470-2045(00)00254-0.
- Leon-Ferre, Roberto A, and Matthew P Goetz. “Advances in systemic therapies for triple negative breast cancer.” BMJ, 30 May 2023, https://doi.org/10.1136/bmj-2022-071674.
- Luo, W et al. “GSTM4 is a microsatellite-containing EWS/FLI target involved in Ewing’s sarcoma oncogenesis and therapeutic resistance.” Oncogenevol. 28,46 (2009): 4126-32. doi:10.1038/onc.2009.262
- Obidiro, Onyinyechi, et al. “Triple negative breast cancer treatment options and limitations: Future outlook.” Pharmaceutics, vol. 15, no. 7, 23 June 2023, p. 1796, https://doi.org/10.3390/pharmaceutics15071796.
- “Oligopeptide.” Oligopeptide – an Overview | ScienceDirect Topics, www.sciencedirect.com/topics/chemistry/oligopeptide#:~:text=The%20RGD%20oligopeptide%20(Arg%2DGly,and%20metastasis%20of%20solid%20tumors%2C. Accessed 5 Aug. 2024.
- Parisi, Eva et al. “PLA2G12A as a Novel Biomarker for Colorectal Cancer with Prognostic Relevance.” International journal of molecular sciences vol. 24,13 10889. 30 Jun. 2023, doi:10.3390/ijms241310889
- Polyak, Kornelia. “Breast cancer: Origins and evolution.” Journal of Clinical Investigation, vol. 117, no. 11, 1 Nov. 2007, pp. 3155–3163, https://doi.org/10.1172/jci33295.
- Pruitt, Kim D, et al.. “Introducing RefSeq and LocusLink: Curated Human Genome Resources at the NCBI.” Redirecting, doi.org/10.1016/S0168-9525(99)01882-X. Accessed 11 July 2024.
- Scarpa, Emanuele S., et al. “A role of intracellular mono‐adp‐ribosylation in cancer biology.” The FEBS Journal, vol. 280, no. 15, 10 May 2013, pp. 3551–3562, https://doi.org/10.1111/febs.12290.
- Shailesh, Harshita et al. “Protein arginine methyltransferase 5 (PRMT5) dysregulation in cancer.” Oncotarget vol. 9,94 36705-36718. 30 Nov. 2018, doi:10.18632/oncotarget.26404
- Shanley, Mathew. “Why Is Cancer Uncommon in Huntington’s Disease Patients?” HCP Live, HCP Live, 4 Feb. 2021, www.hcplive.com/view/cancer-uncommon-in-hd.
- Shao, Changjuan, et al. “Parp12 (ARTD12) suppresses hepatocellular carcinoma metastasis through interacting with FHL2 and regulating its stability.” Cell Death & Disease, vol. 9, no. 9, 28 Aug. 2018, https://doi.org/10.1038/s41419-018-0906-1.
- Smolarz, Beata, et al. “Breast cancer—epidemiology, classification, pathogenesis and treatment (review of literature).” Cancers, vol. 14, no. 10, 23 May 2022, p. 2569, https://doi.org/10.3390/cancers14102569.
- Tang, Doudou, et al. “SRplot: A Free Online Platform for Data Visualization and Graphing.” PloS One, U.S. National Library of Medicine, 9 Nov. 2023, www.ncbi.nlm.nih.gov/pmc/articles/PMC10635526/#:~:text=SRplot%3A%20A%20free%20online%20platform,The%20site%20is%20secure.
- Thion, Morgane Sonia, and Sandrine Humbert. “Cancer: From Wild-Type to Mutant Huntingtin.” Journal of Huntington’s disease vol. 7,3 (2018): 201-208. doi:10.3233/JHD-180290
- “Triple-Negative Breast Cancer: Facts and Stats.” Medical News Today, MediLexicon International, www.medicalnewstoday.com/articles/facts-stats-triple-negative-breast-cancer#:~:text=TNBC%20accounts%20for%20about%2010,females%20in%20the%20United%20States. Accessed 23 July 2024.
- Villarroel, Ariana, et al. “DMSO inhibits human cancer cells and downregulates the expression of cdk2 and cyclin A.” The FASEB Journal, vol. 34, no. S1, Apr. 2020, pp. 1–1, https://doi.org/10.1096/fasebj.2020.34.s1.03158.
- Waks, Adrienne G., and Eric P. Winer. “Breast cancer treatment.” JAMA, vol. 321, no. 3, 22 Jan. 2019, p. 288, https://doi.org/10.1001/jama.2018.19323.
- Wang, Shaowei et al. “Calcium-dependent cytosolic phospholipase A2 activation is implicated in neuroinflammation and oxidative stress associated with ApoE4.” Molecular neurodegeneration vol. 17,1 42. 15 Jun. 2022, doi:10.1186/s13024-022-00549-5
- Wang, Ya;Wang. “Profilin 1 Protein and Its Implications for Cancers.” Cancer Network, MJH Life Sciences, www.cancernetwork.com/view/profilin-1-protein-and-its-implications-for-cancers. Accessed 5 Aug. 2024.
- Welsby, Iain, et al. “Parp12, an interferon-stimulated gene involved in the control of protein translation and inflammation.” Journal of Biological Chemistry, vol. 289, no. 38, Sept. 2014, pp. 26642–26657, https://doi.org/10.1074/jbc.m114.589515.
- Wu, Min, et al. “pla2g12a protects against diet‐induced obesity and insulin resistance by enhancing energy expenditure and clearance of circulating triglycerides.” The FASEB Journal, vol. 38, no. 9, 4 May 2024, https://doi.org/10.1096/fj.202302075r.
- Xu, Xiangwei, et al. “Synthesis of paclitaxel derivatives for remote loading into liposomes and improved therapeutic effect.” Molecules, vol. 27, no. 22, 17 Nov. 2022, p. 7967, https://doi.org/10.3390/molecules27227967.
- Yang, Kaidi, et al. “Identification of key pathways and hub genes in basal-like breast cancer using bioinformatics analysis.” OncoTargets and Therapy, Volume 12, Feb. 2019, pp. 1319–1331, https://doi.org/10.2147/ott.s158619.

