Leveraging Bioinformatics to Uncover Gene Expression Differences in Amyotrophic Lateral Sclerosis (ALS): An Analysis of Key Molecular Pathways and Genes
ABSTRACT
Background
Amyotrophic Lateral Sclerosis (ALS) is a progressive neurodegenerative disease characterized by the degeneration of motor neurons, leading to muscle weakness and paralysis. Despite advances in research, the exact genetic mechanisms underlying ALS remain unclear, posing challenges for developing effective treatments.
Methods
This study aims to identify key genes and molecular pathways associated with ALS using bioinformatics tools. By analyzing gene expression data, we seek to uncover potential biomarkers and therapeutic targets that could aid in understanding and treating the disease. We utilized various bioinformatics databases and tools, including NCBI, GEO2R, GO, and KEGG, to analyze differentially expressed genes (DEGs) in ALS patients compared to healthy controls.
Results
Our analysis focused on identifying significant genes and pathways involved in the disease. The analysis revealed several genes, including FURIN, LGMN, DRD4, CD14, PRKCD, ITGB2, CYBA, and ACTN1, as significantly altered in ALS.
Discussion
These genes are involved in critical processes such as oxidative stress, immune response, and cellular structure maintenance. Pathways related to superoxide anion generation, pattern recognition receptor signaling, and actin filament organization were highlighted.
KEYWORDS: Amyotrophic lateral sclerosis (ALS), Bioinformatics, NCBI, GEO2R, SR Plot, Gene Ontology, KEGG
INTRODUCTION
Amyotrophic Lateral Sclerosis (ALS) is a neurodegenerative disease that affects nerve cells in the brain and spinal cord. ALS leads to loss of muscle control which can lead to many issues in one’s lifetime. ALS is often referred to as Lou Gehrig’s disease after a baseball player was diagnosed with it (A;, B. D. (n.d.). However, the exact cause of the disease is still unknown. Some cases of this disease are inherited. ALS begins with common symptoms of muscle twitching and weakness in an arm or leg and also trouble swallowing or slurred speech. ALS affects control of muscle needed to move, speak, eat and breathe which leads to minimal body function (A;, B. D. (n.d.). ALS is a relatively rare disease with about 1/100,0000 cases. Mutation of superoxide dismutase 1 has been recognized as a potential cause for ALS. ALS usually starts in one specific area but eventually spreads to other parts of the body. The failure of respiratory muscles generally limits survival to 2-5 years after the disease begins. In about 50% of cases, people experience additional issues like changes in behavior, problems with executive functions, and language difficulties. For 10%-15% of patients, these issues are severe enough to be diagnosed as frontotemporal dementia (FTD) (Masrori and Van Damme). About 10% of ALS cases appear to run in families, suggesting an autosomal dominant inheritance pattern. The other 90% of cases don’t have any family history of the disease and are classified as sporadic ALS (Masrori and Van Damme).
Recently, two medications, riluzole and edaravone, have been approved for treatment, offering a slight increase in survival time (Rokade et al.). However, many innovative experimental drugs are being developed. The use of bioinformatics will allow to find genes that are upregulated and downregulated in genetic pathways allowing to find DEG’s to predict the disease.
Background and Significance
Amyotrophic Lateral Sclerosis (ALS) is a progressive neurodegenerative disease that affects nerve cells in the brain and the spinal cord. This disease is sometimes referred to as Lou Gehrig’s disease, after the famous baseball player who was diagnosed with it. ALS leads to the loss of motor neurons, which are responsible for controlling voluntary muscle movements (Brotman et al.). The exact cause of ALS is unknown, but it is believed to be a combination of genetic and environmental factors. About 10% of cases are familial, meaning they are inherited through mutations in specific genes such as SOD1, C9orf72, TARDBP, and FUS (Masrori and Van Damme). The remaining 90% of cases are sporadic, meaning that there is no familial history linked to the diagnoses.
Despite significant research, the cause of ALS remains unknown. Genetic mutations account for about 10% of cases (familial ALS), the majority are sporadic, with no clear genetic link. Due to this research is needed to identify a way to predict ALS through DEGs and potential biomarkers.
Scientific Question
In this research study, the gene expression profiles of spinal and oculomotor tissue samples from control and individuals with sporadic ALS are compared. The primary question presented by this research is “Which specific genes and genetic pathways show upregulation or downregulation in ALS, and how can these discoveries enhance genetic testing and preventative strategies for those at risk of developing ALS?” Identifying these differences in genes will allow us to pinpoint certain areas and contribute to finding a cure for the disease. This question is crucial to pave the way for understanding the mechanisms that take place before ALS is diagnosed
Research Goals and Hypothesis
The primary goal of this research is to identify the genes and genetic pathways that are differently expressed in ALS patients compared to healthy individuals. This will help future research in developing genetic tests and preventative measures, potentially leading to earlier interventions and better management of ALS. To achieve this, various bioinformatics tools and databases, such as the National Center for Biotechnology Information (NCBI), GEO2R, and SGplot will be used.
Hypothesis: There will be differences in gene expression between oculomotor tissue sporadic and control samples in ALS and the diseased samples will have higher levels of gene expression.
METHODS
Preparation of GEO Dataset:
The dataset, GSE833, was generated from a study that compared post-mortem samples of control, healthy spinal tissue with samples from both familial and sporadic ALS-affected individuals. Gene expression was measured through microarray analysis. The GSE833 dataset analyzed the total RNA extracted from postmortem gray matter of lumbar spinal cord from 11 individuals, including five with sporadic-ALS (two samples were confirmed to have mutations associated with familial ALS and were excluded from this study) and four normal controls. Microarray analysis, including quantification and normalization of gene expression levels, was conducted using Affymetrix GeneChip 3.1 software (Dangond et al.).
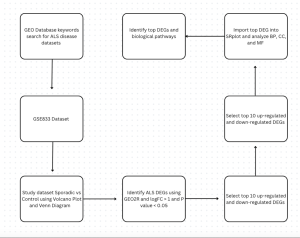
Figure 1. This flowchart shows the methods used in this study to investigate gene expression differences in Amyotrophic lateral sclerosis (ALS), and datasets GSE833 was used. First, the datasets were found using key search words in the GEOdatabase. Then DEGs were identified using GEO2R, and statistics of P-value < 0.05 and |log2FC| > 1.0. Then, the top 25 up and down regulated genres were identified and imported into SR Plot to study BP, CC, AND MF.
Collection of Data
Firstly, data was collected by researching articles on ALS and analyzing it with GEO2R. The study chosen was a data set GSE833 which was the comparison of sporadic ALS and healthy control samples. Samples were collected from post-mortem spinal cord gray matter. The data was divided into two groups control and sporadic meaning ALS was diagnosed with no familial history. The two groups were divided and the graphs were made.
RESULTS
Identifying differentially expressed genes in ALS control vs sporadic samples
Using dataset GSE833 the top 25 upregulated and downregulated genes were identified using P-value < 0.05 and |log2FC| > 1.0. The genes were imported into SR Plot for further analysis. The R Script is also linked.
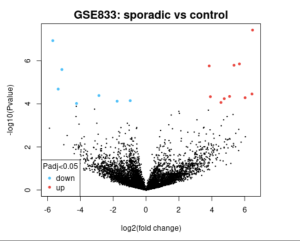
Figure 2. Volcano Plot The image is a volcano plot from a study comparing sporadic cases to a control group, labeled “GSE833: sporadic vs control.” The x-axis represents the log2(fold change), while the y-axis represents the -log10(P value). Significant data points are highlighted in blue (downregulated) and red (upregulated) with an adjusted P value less than 0.05. The central black cluster represents non-significant data points. The plot visually distinguishes genes with significant expression changes between the two groups.
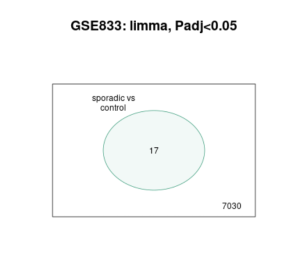
Figure 3. Venn Diagram image is a Venn diagram from a study comparing gene expression in sporadic ALS cases to a control group, labeled “GSE833: limma, Padj<0.05.” The diagram shows two sets of genes: those in sporadic ALS cases and those in controls. The overlap in the center, containing the number 17, represents the genes that are significantly differentially expressed between the two groups. The number 7030 outside the overlap indicates the total number of genes analyzed in the study. This diagram visually highlights the subset of genes that exhibit significant expression changes in sporadic ALS compared to controls, with an adjusted P value of less than 0.05.
SR Plot Analysis
After identifying top 30 DEG, they were imported into SR plot to create graphs to identify biological pathways and cellular components.
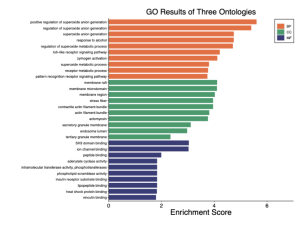
Figure 4. GO results of three ontologies. This bar plot shows the enrichment scores for Gene Ontology (GO) terms across three categories: Biological Process (BP), Cellular Component (CC), and Molecular Function (MF). The most enriched terms include positive regulation of superoxide anion generation, regulation of superoxide metabolic process, and superoxide anion generation in the Biological Process category. The Cellular Component category highlights terms like membrane raft, membrane microdomain, and membrane region. In the Molecular Function category, terms such as SH3 domain binding, ion channel binding, and peptide binding are significantly enriched. Due to these results only biological processes and cellular components will be studied as they are the most enriched.
After analyzing this data it can be seen that the biological pathway and cellular components are highly enriched. The GO analysis for these areas will be below.
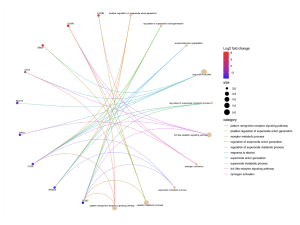
Figure 5. This cnet plot shows the connections between specific genes and their associated biological processes in sporadic ALS patients. The genes with higher log2 fold changes are highlighted in red, indicating their significant upregulation. Genes such as FURIN, LGMN and DRD4 are significantly enriched.
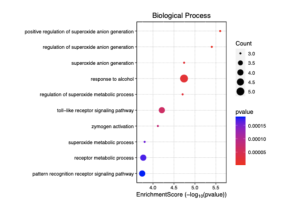
Figure 6: This dotplot visualizes the enrichment scores of various biological processes in sporadic ALS patients. The x-axis represents the enrichment score (-log10(p-value)), indicating the significance of each process. The size of the dots reflects the number of genes (count) involved in each process, while the color gradient represents the p-value, with red indicating lower p-values (higher significance).
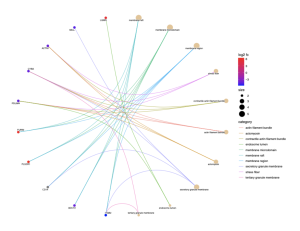
Figure 7: This cnet plot shows the relationships between specific genes and their associated cellular components in sporadic ALS patients. Genes with high log2 fold changes are highlighted in red, portraying significant upregulation. Key genes such as FURIN, LGMN, and CYBA are associated with components like membrane rafts, membrane microdomains, and stress fibers. The size of the nodes represents the significance of the enrichment scores, with larger nodes indicating higher significance. This plot highlights the involvement of various cellular structures in the pathogenesis of ALS.
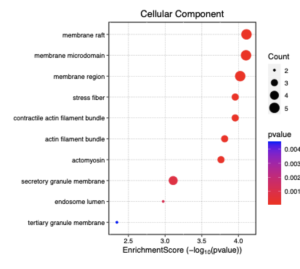
Figure 8: This dotplot shows the enrichment scores of different cellular components in sporadic ALS patients. The x-axis represents the enrichment score (-log10(p-value)), showing the significance of each component. The size of the dots reflects the number of genes (count) involved in each component, while the color gradient represents the p-value, with red indicating lower p-values (higher significance). The three most enriched cellular components are membrane raft, membrane microdomain and membrane region.
Table 1. This table shows the top DEGs from the BP and CC analysis. The name of the gene is shown on the left of the table. In the middle, the function/pathway of the gene is shown and the genes’ connection to ALS is discussed.
Gene | Function/Pathway | Connection to ALS |
FURIN | Positive Regulation of Superoxide Anion Generation | FURIN: Furin is a proprotein convertase involved in the processing of various precursor proteins. Its dysregulation has been implicated in several neurological conditions, including ALS. Furin influences neuroinflammation and neurodegeneration through its role in cytokine production and the activation of pro-inflammatory genes in macrophages(Zhang et al.). |
LGMN | Superoxide Anion Generation | LGMN (Legumain): Legumain is an asparaginyl endopeptidase implicated in lysosomal processing and degradation. Recent studies suggest that its upregulation contributes to the pathological protein aggregation seen in ALS, potentially through mechanisms involving oxidative stress and inflammation (Thomas Sumner). |
DRD4 | Regulation of Superoxide Anion Generation | DRD4 (Dopamine Receptor D4): Although primarily studied in the context of psychiatric disorders, alterations in dopamine signaling have been observed in ALS patients, linking DRD4 to the modulation of oxidative stress pathways that exacerbate neurodegeneration (Science Daily ). |
CD14 | Pattern Recognition Receptor Signaling Pathway | CD14: CD14 is a pattern recognition receptor that plays a crucial role in the innate immune response. It has been linked to ALS through its involvement in microglial activation and the neuroinflammatory response, which are key components of ALS pathology (Cordova et al.). |
PRKCD | Toll-like Receptor Signaling Pathway | PRKCD (Protein Kinase C Delta): This gene is part of the Toll-like receptor signaling pathway, which is crucial for the innate immune response. PRKCD is involved in neuroinflammation and has been shown to affect neuronal survival in ALS models (Zhang et al.). |
ITGB2 | Pattern Recognition Receptor Signaling Pathway | ITGB2 (Integrin Subunit Beta 2): ITGB2 is involved in leukocyte adhesion and migration, processes that are dysregulated in ALS. The gene’s role in modulating neuroinflammation through microglial activation highlights its importance in ALS pathology (Zhang et al.). |
CYBA | Membrane Raft | CYBA (Cytochrome b-245 Alpha Chain): CYBA is a component of the NADPH oxidase complex, involved in reactive oxygen species (ROS) production. Increased ROS production is a hallmark of ALS, linking CYBA to oxidative stress and neuronal damage observed in the disease (“https://www.ncbi.nlm.nih.gov/gene?Db=gene&Cmd=DetailsSearch&Term=1536”). |
ACTN1 | Actin Filament Bundle | ACTN1 (Actinin Alpha 1): ACTN1 plays a role in actin filament organization. Mutations and dysregulation in cytoskeletal proteins, including ACTN1, have been associated with ALS, affecting neuronal structure and function(“ACTN1 Actinin Alpha 1 [Homo Sapiens (Human)] – Gene – NCBI”). |
DISCUSSION
Amyotrophic lateral sclerosis (ALS) is increasing everyday and there is no clear method for recovery. Predicting the disease early on and developing a plan for prevention will halt the spread of the disease. This research study aimed to find highly enriched genes in ALS vs control patients to identify potential biomarkers. Utilizing GEO2R, NCBI and SRPlot several highly enriched genes were found as seen in Table 1 and a potential link to ALS based on previous research. Eight highly expressed genes were found in Figure 5 and 7. The analysis revealed key genes including FURIN, LGMN, DRD4, CD14, PRKCD, ITGB2, CYBA, and ACTN1 (Table 1) Specifically, CD14, another highly expressed gene in our study, expresses a surface antigen primarily found on monocytes and macrophages. It plays an important role in the innate immune response by interacting with bacterial lipopolysaccharides and viruses. A study by Zhang et al. (2020) indicated that CD14 is involved in the inflammatory response in ALS, contributing to the disease’s progression by promoting neuroinflammation (Lu et al, 2020). Also, CD14 has also been considered as a potential cure for reducing severe inflammation in SARS-CoV-2 infections (NIH, 2024).
These genes are involved in critical processes such as oxidative stress response, immune response, and cellular structure maintenance (Figure 6 & 8) . The results of this study show that these identified genes play crucial roles in ALS pathology. For example, FURIN is involved in oxidative stress responses, while CD14 and PRKDC are significant in immune response and inflammation (Table 1). These findings support the hypothesis that ALS is driven by multiple genetic interactions that impact multiple cellular processes.
Findings
The findings from this study align with previous research showcasing the role of oxidative stress and neuroinflammation in ALS progression. For example, FURIN has been linked to neurodegenerative diseases through involvement in processing neurotrophic factors and proteases, which are essential for neuronal survival (NIH, 2024). Similarly, CD14, another highly expressed gene encodes a surface antigen primarily found on monocytes and macrophages. It works with other proteins to drive the innate immune response against bacterial lipopolysaccharides and viruses. It’s also being considered as a target for treating SARS-CoV-2 infections to help reduce severe inflammation (NIH, 2024). The findings are similar to previous research that show the roles of oxidative stress and neuroinflammation in ALS disease. For example, FURIN has been connected to neurodegenerative diseases through involvement in processing neurotrophic factors and proteases essential for neuronal survival. A study shows that FURIN is crucial for the proteolytic activation of neurotrophic factors, and its dysregulation is associated with ALS and other neurodegenerative disorders (Anestopoulos et al, 2017).
A study published in Scientific Reports shows that FURIN is involved in ALS pathology, specifically in the endoplasmic reticulum stress response, which is a main feature of ALS (Yamada et al, 2018).
Implications
One implication of these genes is that it provides for clinical applications such as developing new therapy options for ALS. By understanding the molecular pathways behind ALS new treatments can be developed which target these genes and their associated pathways. This could involve gene-based therapies or small molecule inhibitors designed to combat oxidative stress or control immune responses in ALS patients.
Limitations
Some limitations of the study are that, first, the sample size is too small. Additionally, since the data from previous experiments was used, therefore, more validation from laboratory or clinical settings is required. Also, more datasets and different groups are required to validate the expression of these genes and their relevance to ALS.
Future directions
Further research should focus on validating these genes in laboratory experiments and clinical trials. Through this the functional role of these genes in ALS can be validated. This can lead to the development of gene therapies. The identified genes can be tested in the laboratory by scientists in the laboratory or clinical trials to determine if a potential biomarker can be identified.
Conclusion
In conclusion, this study utilized bioinformatics tools and databases to explore the genetic links between specific genes and Amyotrophic Lateral Sclerosis (ALS). Our analysis focused on several key genes—FURIN, LGMN, DRD4, CD14, PRKCD, ITGB2, CYBA, and ACTN1—and their associated biological processes and pathways, such as neuroinflammation, oxidative stress, and cytoskeletal integrity.
The discussion and results show that these genes are important in the prognosis of ALS. Genes such as FURIN and LGMN are involved in oxidative stress regulation, while CD14 and PRKCD participate in neuroinflammatory pathways. These results as well as knowing what each gene means can help to understand ALS effectively and potentially develop treatments. The hypothesis of this experiment was that there will be differentially expressed genes when comparing the control and sporadic group. This was true as several DEGs were identified throughout the experiment.
Although these genes were identified. Future research should focus on experimental validation of these genetic associations and explore the molecular interactions in greater detail. Through future research more thoroughly developed molecular pathways can be formed ultimately improving patient outcomes and quality of life.
References
- A, B. D. “Update on Genetics of Amyotrophic Lateral Sclerosis.” Current Opinion in Neurology, n.d., https://pubmed.ncbi.nlm.nih.gov/35942673/.
- A, K. R. M. S. “Amyotrophic Lateral Sclerosis (ALS) Prediction Model Derived from Plasma and CSF Biomarkers.” PLOS ONE, n.d., https://pubmed.ncbi.nlm.nih.gov/33606761/.
- BJ, C. R. A. “Novel Genes Associated with Amyotrophic Lateral Sclerosis: Diagnostic and Clinical Implications.” The Lancet Neurology, n.d., https://pubmed.ncbi.nlm.nih.gov/29154141/.
- Brotman, Ryan G., et al. “Amyotrophic Lateral Sclerosis.” StatPearls Publishing, 22 Aug. 2022, www.ncbi.nlm.nih.gov/books/NBK556151/.
- “CD14 CD14 Molecule [Homo Sapiens (Human)] – Gene – NCBI.” NCBI, www.ncbi.nlm.nih.gov/gene/929. Accessed 12 Apr. 2024.
- Clough, Emily, and Tanya Barrett. “The Gene Expression Omnibus Database.” SpringerLink, Springer New York, 2016, link.springer.com/protocol/10.1007/978-1-4939-3578-9_5.
- Cordova, Zuzet Martinez, et al. “Myeloid Cell Expressed Proprotein Convertase FURIN Attenuates Inflammation.” Oncotarget, vol. 7, no. 34, 5 Aug. 2016, pp. 54392–54404,www.ncbi.nlm.nih.gov/pmc/articles/PMC5342350/, doi:10.18632/oncotarget.11106. Accessed 2 Dec. 2022.
- “CYBA Cytochrome B-245 Alpha Chain [Homo Sapiens (Human)] – Gene – NCBI.” NIH.gov, 2024, www.ncbi.nlm.nih.gov/gene/1535. Accessed 6 Aug. 2024.
- Dameron, O., Bettembourg, C., and N. L. Meur. “Measuring the Evolution of Ontology Complexity: The Gene Ontology Case Study.” PLOS ONE, n.d., https://journals.plos.org/plosone/article?id=10.1371%2Fjournal.pone.0075993.
- “FURIN Furin, Paired Basic Amino Acid Cleaving Enzyme [Homo Sapiens (Human)] – Gene – NCBI.” NCBI, www.ncbi.nlm.nih.gov/gene/5045.
- “Gene Ontology Overview.” Gene Ontology Resource, 11 July 2024
- “Genetic Link between Both Types of ALS Discovered.” ScienceDaily, 2024, www.sciencedaily.com/releases/2010/05/100505173014.htm. Accessed 6 Aug. 2024.
- “How ALS Progresses on Genetic and Cellular Level Revealed by High-Res Spinal Cord Study.” Simons Foundation, 4 Apr. 2019, www.simonsfoundation.org/2019/04/04/als-progression-genetic-cellular/.
- Anestopoulos, Ioannis, et al. “A Novel Role of Silibinin as a Putative Epigenetic Modulator in Human Prostate Carcinoma.” Molecules, vol. 22, no. 1, 31 Dec. 2016, pp. 62–62, www.ncbi.nlm.nih.gov/pmc/articles/PMC6155798/, doi:10.3390/molecules22010062. Accessed 17 Aug. 2024.
- “Kegg Pathway Map (HELP).” KEGG, n.d.,
- Masrori, P., and P. Van Damme. “Amyotrophic Lateral Sclerosis: A Clinical Review.” European Journal of Neurology, vol. 27, no. 10, 7 July 2020, pp. 1918–1929, www.ncbi.nlm.nih.gov/pmc/articles/PMC7540334/, doi:10.1111/ene.14393.
- Rokade, Aditi V., et al. “Riluzole and Edavarone: The Hope against Amyotrophic Lateral Sclerosis.” Cureus, 7 Oct. 2022, doi:10.7759/cureus.30035.
- Sabatelli, M., et al. “New ALS-Related Genes Expand the Spectrum Paradigm of Amyotrophic Lateral Sclerosis.” Brain Pathology, n.d., https://pubmed.ncbi.nlm.nih.gov/26780671/.
- Tang, Doudou, et al. “SRplot: A Free Online Platform for Data Visualization and Graphing.” PLOS ONE, U.S. National Library of Medicine, 9 Nov. 2023,
- Vidovic, M., Müschen, L. H., Brakemeier, S., Machetanz, G., & Naumann, M. “Current State and Future Directions in the Diagnosis of Amyotrophic Lateral Sclerosis.” Cells, n.d., https://pubmed.ncbi.nlm.nih.gov/36899872/.
- Yamada, Mariko, et al. “Furin Inhibitor Protects against Neuronal Cell Death Induced by Activated NMDA Receptors.” Scientific Reports, vol. 8, no. 1, 26 Mar. 2018, doi:10.1038/s41598-018-23567-0. Accessed 4 Apr. 2022.
- Zhang, Yi, et al. “The Emerging Role of Furin in Neurodegenerative and Neuropsychiatric Diseases.” Translational Neurodegeneration, vol. 11, no. 1, 23 Aug. 2022, doi:10.1186/s40035-022-00313-1.


