Using Bioinformatics to Investigate Potential Molecular Biomarkers that link Alzheimer’s Disease with Type 2 Diabetes

Divya Ariyur - Using Bioinformatics to study Alzheimer’s Disease and Type 2 Diabetes
ABSTRACT
The prevalence of Alzheimer’s disease (AD) and Type 2 Diabetes (T2D) is increasing worldwide. These diseases both present global health issues with serious impacts on human well-being and considerable effects on the costs of healthcare systems. Although traditionally considered as independent disease conditions, several studies have suggested a connection between AD and T2D. This is because AD and T2D have similarities of shared risk factors, impact on cognitive function or thinking and impact on brain function. A few recent studies have actually shown that having diabetes increases the chances of getting AD. However, the exact nature of the connection is still being investigated. Alzherimer’s disease is a progressive and irreversible brain disorder that affects memory, thinking, and behavior. It is the most common cause of dementia in older adults, leading to decline in cognitive function and the ability to perform daily tasks. Among the many factors that contribute to the cause of AD, genetic or molecular factors is one of them. Mutation or changes in certain genes is known to increase the risk of developing AD. However, not everyone who has a mutation in any of these genes ends us with AD. It is possible that there are other genes, not yet discovered, that contribute to the cause of AD. On the other hand, Type 2 diabetes is a chronic metabolic disorder characterized by insulin resistance and high blood sugar levels. It often develops in adulthood and is associated with lifestyle factors, genetics, and obesity. Type 2 diabetes mellitus is also linked to problems with cognition or thinking and metabolic issues, which make cells more likely to be affected, thus increasing the chances of developing late-onset Alzheimer’s disease as people age. In fact some research has proposed the term “type 3 diabetes” for Alzheimer’s disease. While evidence suggests a link between Alzheimer’s disease and Type 2 diabetes, the exact nature of the connection is still not established. One way to address this research gap is to identify genes that are shared between AD and T2D. Therefore, this study used several bioinformatics tools and databases, namely, NCBI, GEO, SR Plot, GO and KEGG, to identify genes that are potentially shared between AD and T2D. Results show that genes, SLC19A1, SLC2A2, SERPINA3, REG1A, and HGF from T2D have an association with Alzheimer’s. While, genes TFAP2A, HAPLN2, and SCUBE1 from AD have an association with Type 2 diabetes. These eight genes are potential biomarkers that can contribute to the development of treatment methods that can simultaneously target and tackle both Alzherimer’s disease and Type 2 Diabetes.
Keywords: Bioinformatics, NCBI, GEO, SR Plot, GO, KEGG, Alzheimer’s disease (AD), Type 2 Diabetes (T2D), genes, biomarkers
INTRODUCTION
Incidence of Alzheimer’s disease and Type 2 Diabetes
The occurrence of Alzheimer’s disease (AD) and Type 2 Diabetes (T2D) is on the rise globally (Moheet et al, 2015; Chung and Lee, 2021). These conditions pose significant global health concerns, affecting human well-being and placing a strain on healthcare systems (Moheet et al, 2015). While historically viewed as separate illnesses, various studies have proposed a link between AD and T2D. They are both associated with aging, where higher rates of occurrences are seen as people grow older. It is estimated that millions of people worldwide are affected by Alzheimer’s. In the United States, for example, in 2023, it was estimated that around 6.7 million Americans were living with Alzheimer’s disease (Alzheimer’s disease facts and figures, 2023). It’s more prevalent among women than men. As for T2D, the global incidence is also on the rise, especially among adults. Type 2 Diabetes is closely linked to factors such as aging, unhealthy living habits, and obesity, as noted by Tuomi (2005) and Barbagallo and Dominguez (2014). An estimation made 22 years ago indicated that by 2025, the number of diabetic patients will reach 300 million (International Diabetes Federation, 2001; Adeghate, Schattner, Dunn, 2006).
What is Alzheimer’s disease?
Alzheimer’s disease is a progressive and irreversible brain disorder that affects memory, thinking, and behavior (Alzheimer’s Association. 2023; Breijyeh and Karaman, 2000; De-Paula et al, 2012). It is the most common cause of dementia in older adults, leading to decline in cognitive or thinking function and the ability to perform daily tasks. Alzheimer’s diseases’ prevalence increases with age (Breijyeh and Karaman, 2000; De-Paula et al, 2012). AD is characterized by the loss of synapses in many brain regions including the hippocampus and the deposition of abnormal proteins called amyloid beta (Aβ) and tau (Jack and Holtzman, 2013).
Many different factors are known that increase the risk of developing AD. These include genetics or biological molecules, lifestyle and the environment (Breijyeh and Karaman, 2000). Although many different factors have an impact on the development of AD, genes or molecular markers show a strong influence of the risk of developing the disease (Bertram et al, 2003; Bertram and Tanzi, 2004; Sauders et al, 1993). Mutations or changes in certain genes are known to increase the risk of Alzheimer’s disease (Breijyeh and Karaman, 2000). For example, changes or mutations in the UBQLN1 gene on chromosome 9q22 substantially increase the risk of Alzheimer’s disease, possibly by influencing alternative splicing of this gene in the brain (Bertram et al, 2003).
Further, a gene called apolipoprotein E (APOE) is the most common gene linked to late-onset Alzheimer’s disease. On the other hand, the risk of early-onset Alzheimer’s disease is characterized by several genes including, Amyloid precursor protein (APP), Presenilin 1 (PSEN1) and Presenilin 2 (PSEN2) genes (Breijyeh and Karaman, 2000).
However, not everyone who has a mutation in any of these genes ends us with AD. Therefore, the genetic basis of the disease is not yet established and this is a research gap this current study is addressing. Results from this study are important in contributing to the identification of genes or biological markers related to AD and T2D that can serve as potential targets for treatment.
What is Type 2 Disease?
Type 2 diabetes (T2D) is a chronic condition where the body doesn’t respond effectively to insulin or doesn’t produce enough insulin (Basu, 2017; Barbagallo and Dominguez, 2014; Ye et al, 2023). It’s often related to obesity and lifestyle factors and can lead to high blood sugar levels. The prevalence of Type 2 diabetes is increasing globally, particularly among adults, and is associated with factors like aging, unhealthy lifestyles, and obesity. (Tuomi, 2005; Barbagallo and Dominguez, 2014). Certain populations, including specific ethnic groups, have a higher risk (McQueen, 2023).
Several environmental and genetic factors are known to cause T2D. Environmental factors include being overweight, nutrition/diet, toxins, drugs and not being physically active. Genetic or inheritance factors include insulin resistance and changes in certain genes (Ali, 2013).
On the genetic level, some studies have identified genes that are associated with T2D. Examples include potassium inwardly-rectifying channel, subfamily J, member 11 (KCNJ11), Wolfram syndrome 1 (wolframin) (WFS1), peroxisome proliferator-activated receptor gamma (PPARG), insulin receptor substrate 1 (IRS1) and IRS-2, , HNF1 homeobox A (HNF1A), HNF1 homeobox B (HNF1B) and HNF4A (Ali, 2013). For most of these genes, their function or mechanism of action remain unclear. And it is possible that other genes, yet to be identified, are linked with T2D.
Potential link between Alzheimer’s disease and Type 2 Diabetes
Evidence suggests a link between Alzheimer’s disease and Type 2 diabetes due to shared risk factors, impact on cognitive function or thinking and impact on brain function (Moran et al, 2013; Moheet et al, 2015; Miles and Roof, 1922; Biessels, 2006; Rojas et al, 2021). But the exact nature of the connection is still under investigation. So far, studies have shown that diabetes has an impact on cognitive function and brain structure (Moheet et al, 2015). In fact, diabetes has been known to have an effect on the brain for more than one hundred years. For example, one study showed that people with diabetes performed poorly on cognitive tasks examining memory and attention (Miles and Roof, 1922). Another study used microarray data to identify genes that are differentially expressed (DEGs) to determine the potential pathophysiological mechanisms that are shared between AD and T2D (Ye et al, 2023).
Furthermore, recent studies show that having diabetes increases the chances of getting AD (Baglietto-Varga et al, 2016). In addition, diabetes and Alzheimer’s share multiple neuropathological mechanisms and anti-diabetic compounds are a promising therapeutic approach for AD patients (Baglietto-Varga et al, 2016). Therefore, it is important to understand how diabetes and Alzheimer’s diseases are connected. It could help find new ways to slow down or stop the onset and progress of Alzheimer’s disease (Baglietto-Varga et al, 2016) and diabetes.
One way to understand this connection is to identify genes or molecular biomarkers that are similar between AD and Diabetes. While some genes have been identified that potentially link AD to T2D, it is possible there are more genes yet to be discovered. Therefore, the goal of this current study is to identify novel genes or molecular biomarkers that potentially link AD and T2D. To achieve this, NCBI, GEO, SR Plot, GO and KEGG Bioinformatics tools and databases were used.
Using NCBI and GEO2R, we identified a total of 40 genes that are differentially expressed (DEGs), 20 in AD and 20 in T2D between the controls and the patients. These were further analyzed and validated using SR Plot, KEGG and GO bioinformatics tools to give a final total of 8 genes. Among the 8 genes, 3 from the AD dataset and 5 from the T2D dataset showed the potential to be common between AD and T2D. These eight genes represent potential genetic or molecular biomarkers that may aid in the potential development of treatment strategies capable of addressing both Alzheimer’s disease and Type 2 Diabetes at the same time.
METHODS
To investigate potential genetic or molecular biomarkers that are shared between Alzheimer’s disease (AD) and Type 2 Diabetes mellitus (T2D), this research used different Bioinformatics tools and databases. The method workflow is shown in Figure 1. First, I navigated through the extensive Gene Expression Omnibus (GEO) bioinformatics tool within NCBI, which contains genetic information contributed by different researchers worldwide (Edgar et al., 2002).
NCBI (National Center for Biotechnology Information) is a U.S. government bioinformatics platform that provides access to various biological and genomic databases and resources. It serves as a key hub for research in the life sciences. On the other hand, GEO is a tool within the NCBI’s Gene Expression Omnibus (GEO) database (GEO, 2019) GEO uses algorithms to analyze and compare gene expression data from RNA sequencing experiments, identifying genes that are differentially expressed between conditions, such as disease vs. control. Therefore, researchers use GEO to explore and extract valuable information from gene expression datasets (GEO Overview – GEO – NCBI, n.d.).
To identify genes or molecular biomarkers that overlap AD and DM, keyword searches were conducted focusing on Alzheimer’s disease (AD) and Type 2 Diabetes mellitus (DM). This systematic search led to the discovery of two microarray datasets: GSE97760 and GSE20966. The GSE97760 dataset contains patients with AD (n = 9) and healthy controls (n = 10) (Naughton et al., 2015). GSE20966 consists of patients with DM (n = 10) and healthy controls (n = 10) from samples of β-cells obtained from normal pancreases (Zhong et al, 2019).
Identification of Differentially Expressed Genes (DEGs) with GEO2R
GEO2R (GEO2R – GEO – NCBI, n.d.) is an interactive online tool within NCBI used to compare and analyze two datasets collected under the same experimental conditions. It employs GEO query and limma to perform differential expression analysis. In this study, GEO2R was used to investigate differentially expressed genes (DEGs) between T2D and control samples.
DEGs are genes that exhibit statistically significant changes in expression levels in response to different experimental conditions (Anjum et al, 2016). These conditions can include various factors like different tissues, treatments, disease states, developmental stages, or environmental stimuli (Anjum et al, 2016). DEGs were considered statistically significant when ∣logFC | ≥1 and the P value < 0.05, serving as the cutoff criteria. The probe IDs were converted to gene symbols. Any single probe corresponding to multiple genes was removed. The top 10 upregulated DEGs and 10 downregulated genes were selected for further analysis. This procedure was repeated to investigate DEGs between AD and normal samples (Supplementary data).
SR Plot, Gene Ontology and Pathway Enrichment Analysis of DEGs
SR Plot is an online bioinformatics tool that helps plot and visualize biological data and analysis including genes, genomes, transcriptomics and epigenomics (SRplot- Science and Research Online Plot, n.d.). In addition, SR Plot can be used to perform Gene Ontology (GO) and Kyoto Encyclopedia of Genes and Genomes (KEGG) pathway enrichment analysis.
GO is a common way to annotate genes, gene products, and sequences as potential biological phenomena, mainly including biological process (BP), cellular component (CC), and molecular function (MF). The biological process describes the major processes, or ‘biological programs’ that are accomplished by multiple molecular activities. Meanwhile, the cellular component refers to the location of the gene in questions, relative to cellular compartments and structures. The molecular function describes the activities that occur at the molecular level. Kyoto Encyclopedia of Genes and Genomes (KEGG) is a comprehensive database resource for the biological interpretation of genomic sequences and other high-throughput data (Zhu et al., 2020).
In this study, I used NCBI and GEO2R to identify DEGs in AD and T2D. Then GO and KEGG analyses for the top 20 DEGs in each dataset were performed using the SR plot online tool (SRplot- Science and Research Online Plot, n.d.) to analyze the DEGs at the functional level. Finally, I selected the genes that potentially connect AD and T2D for further analysis to determine the potential function of the identified genes.
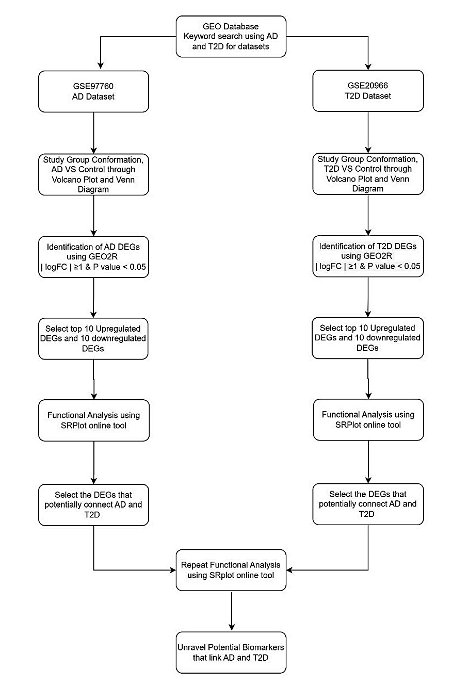
Figure 1: The workflow of the methodology used. NCBI, GEO, SR Plot, GO and KEGG Bioinformatics tools and databases were used . Using NCBI and GEO2R, A total of 40 genes that are differentially expressed (DEGs), 20 in AD and 20 in T2D between the controls and the patients. These were further analyzed and validated using SR Plot, KEGG and GO.
RESULTS
Identification of Differentially Expressed Genes (DEGs)
Differentially expressed genes (DEGs) are genes whose expression levels, typically measured in terms of mRNA or protein abundance using microarray or RNA sequencing experiments, show significant variations between two or more experimental conditions, such as different cell types, tissues, treatments, disease states, or time points (Anjum et al, 2016). DEGs can be either up-regulated (showing increased expression) or down-regulated (showing decreased expression) in one condition compared to another. The identification of DEGs is a fundamental aspect of gene expression analysis and is crucial for understanding the molecular basis of various biological processes and conditions (Anjum et al, 2016).
In this study, the DEGs analyzed were retrieved from microarray experiments conducted by Naughton et al (2015). Specifically, Bioinformatics tool and database GEO2R, housed within NCBI, was used to analyze all the data in the GSE97760 dataset. This dataset contains microarray profiles of blood genome-wide gene expression in female individuals with advanced Alzheimer’s Disease and in healthy controls. The top differentially expressed genes (DEGs) in AD patients and healthy control groups were identified (Figure 2). Figure 2a and 2b shows a volcano plot and venn diagram of the differentially expressed genes (DEGs) between AD and control samples. In the volcano plot, up-regulated genes are represented in red, down-regulated genes in blue, and non significant genes in black. These DEGs were further analyzed by selecting the most negative or most positive values of the ∣logFC | ≥ 1 and selecting the genes with statistically significant values (P < 0.05). Between AD patients and healthy controls, a total of 20 DEGs, including 10 up-regulated DEGs and 10 down-regulated DEGs, were filtered (Supplementary data).

Figure 2: Microarray differential gene analysis in the AD group (a) The Volcano Plot of the genes between AD and controls: red and blue indicate upregulation and downregulation, respectively (b) Venn Diagram of AD and control group.
The same process was repeated for the T2D dataset GSE20966, where DEGs were identified (Figure 3). This dataset contained gene expression profiles derived from beta-cell enriched tissue obtained through Laser Capture Microdissection from individuals with type 2 diabetes (Marselli et al, 2010). Using GEO2R Bioinformatics tool, we identified the DEGs from this dataset (Figure 3) and statistical analyses were used to select a total of 20 DEGs, including 10 up-regulated DEGs and 10 down-regulated DEGs, were chosen between T2D and healthy controls (Supplementary data). Figure 3a and 3b shows the volcano plot and venn diagram of the genes between T2D and control samples. The upregulated genes are indicated in red color in the volcano plot, while the down-regulated genes are shown in blue color. Black color in the volcano plot indicates non-significant genes.

Figure 3: Microarray differential gene analysis in the T2D group (a) The Volcano Plot of the genes between T2D and controls: red and blue indicate upregulation and downregulation, respectively (b) Venn Diagram of T2D and control group.
Analysis of the functional features of common DEGs
GO functions and KEGG Pathway enrichment analyses were performed to analyze the biological functions and pathways involved in the shortlisted DEGs from AD and T2D. AD GO analysis results show the three ontologies bar graph (Figure 4a), biological process (BP) (Figure 4b), which contains extracellular matrix organization, extracellular structure organization, inner ear morphogenesis; cellular components (CC) (Figure S1a), which involved laminin complex, filopodium tip, sterocilium tip; molecular functions (MF) (Figure S1b), such as hyaluronic acid binding, UDP-galactosyltransferase activity and actin-dependent ATPase activity. KEGG Pathways (Figure 4c and Figure S1c) included Galactose metabolism, Viral life cycle – HIV-1, ECM-receptor interaction.
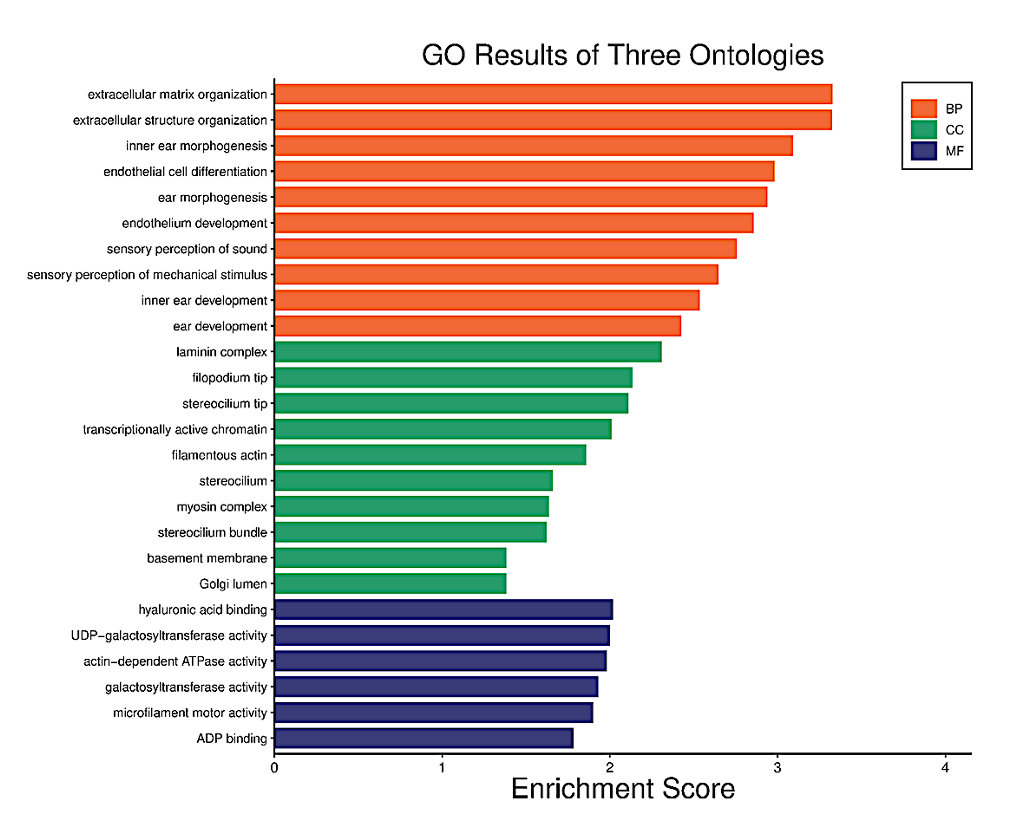
Figure 4a. Functional characteristics analysis for the AD-related DEGs: GO enrichment results of three ontologies. The orange indicates biological processes while the green indicates cellular components and the purple represents molecular functions.
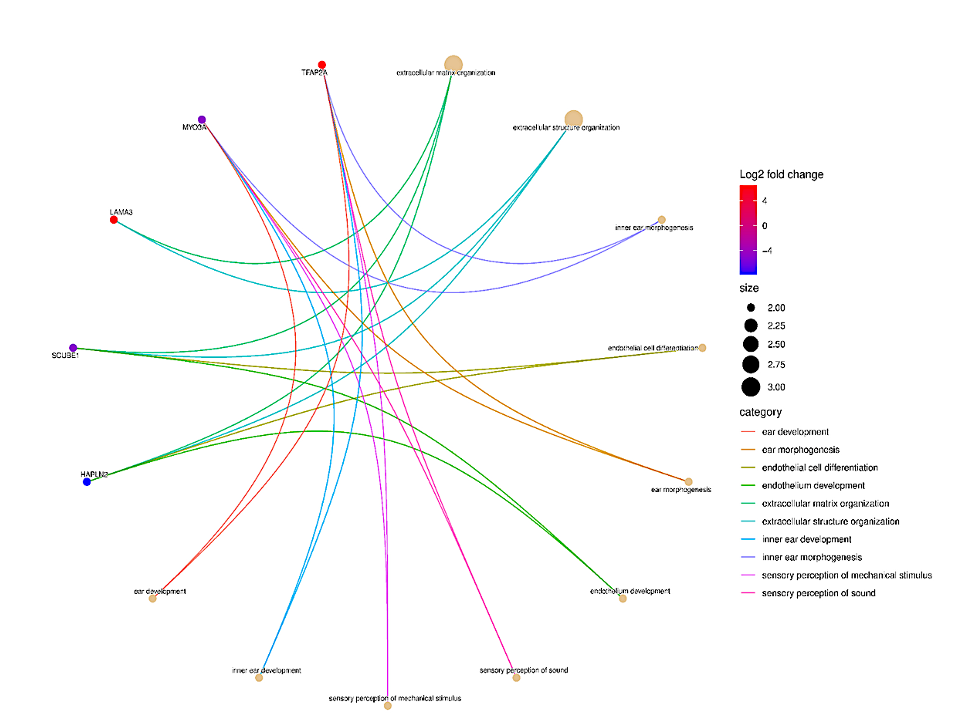
Figure 4b. Functional characteristics analysis for the AD-related DEGs: The Biological Process (BP) category of GO enrichment analysis. The nodes (dots) at the tip of the lines indicate genes. Genes with high log2 fold change are red while those with the lowest log2 fold change are blue in color.
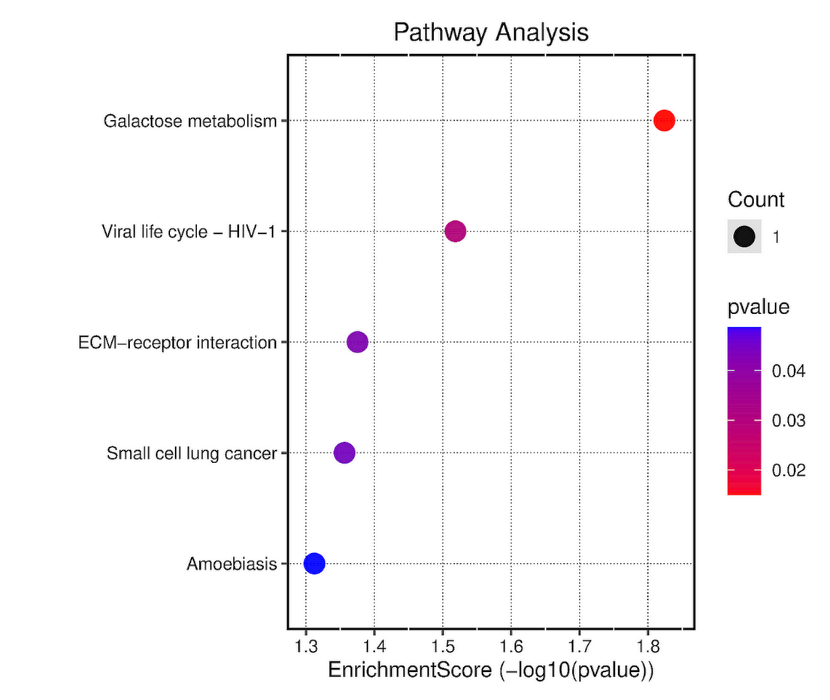
Figure 4c. The dotplot of KEGG pathway enrichment results for AD-related DEGs. The dot size represents the number of genes in each KEGG pathway; p.adjust (adjusted P-value): Red < purple < blue.
T2D GO analysis results show the three ontologies (Figure 5a), biological process (BP) (Figure 5b), which contains hepatocyte growth factor receptor signaling pathway, liver development, hepatobiliary system development; cellular components (CC) (Figure S2a), which involved platelet alpha granule, brush border, apical part of cell; molecular functions (MF) (Figure S2b), such as vitamin transmembrane transporter activity, peptidase regulator activity and growth factor activity. KEGG Pathway (Figure 5c, and Figure S2c) included Glucagon Signaling Pathway, Insulin resistance and Focal adhesion.

Figure 5a. Functional characteristics analysis for the T2D-related DEGs: GO enrichment results of three ontologies. The orange indicates biological processes while the green indicates cellular components and the purple represents molecular functions.

Figure 5b. Functional characteristics analysis for the T2D-related DEGs: The Biological Process (BP) category of GO enrichment analysis. The nodes (dots) at the tip of the lines indicate genes. Genes with high log2 fold change are red while those with the lowest log2 fold change are blue in color.
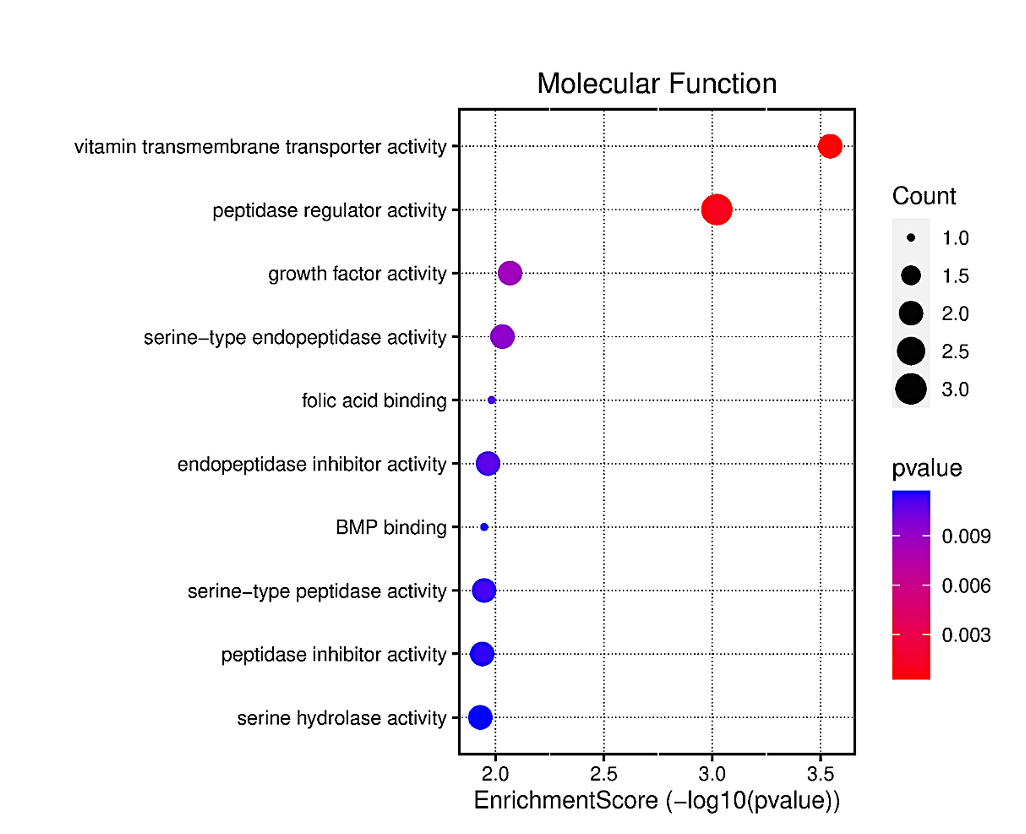
Figure 5c. The dotplot of KEGG pathway enrichment results for T2D-related DEGs. The dot size represents the number of genes in each KEGG pathway; p.adjust (adjusted P-value): Red < purple < blue.
A repeat GO and KEGG Analysis were performed for the selected AD and T2D DEGs. AD GO analysis results (Figure 6) show the three ontologies (Figure 6a), biological process (BP) (Figure 6b), which contains extracellular matrix organization, endothelial cell differentiation, endothelium development; cellular components (CC) (Figure S3a), which involved extrinsic component of plasma membrane, Extrinsic component of membrane; molecular functions (MF) (Figure S3b), such as hyaluronic acid binding, carboxylic acid binding and organic acid binding. There were no KEGG Pathway results for these DEGs.
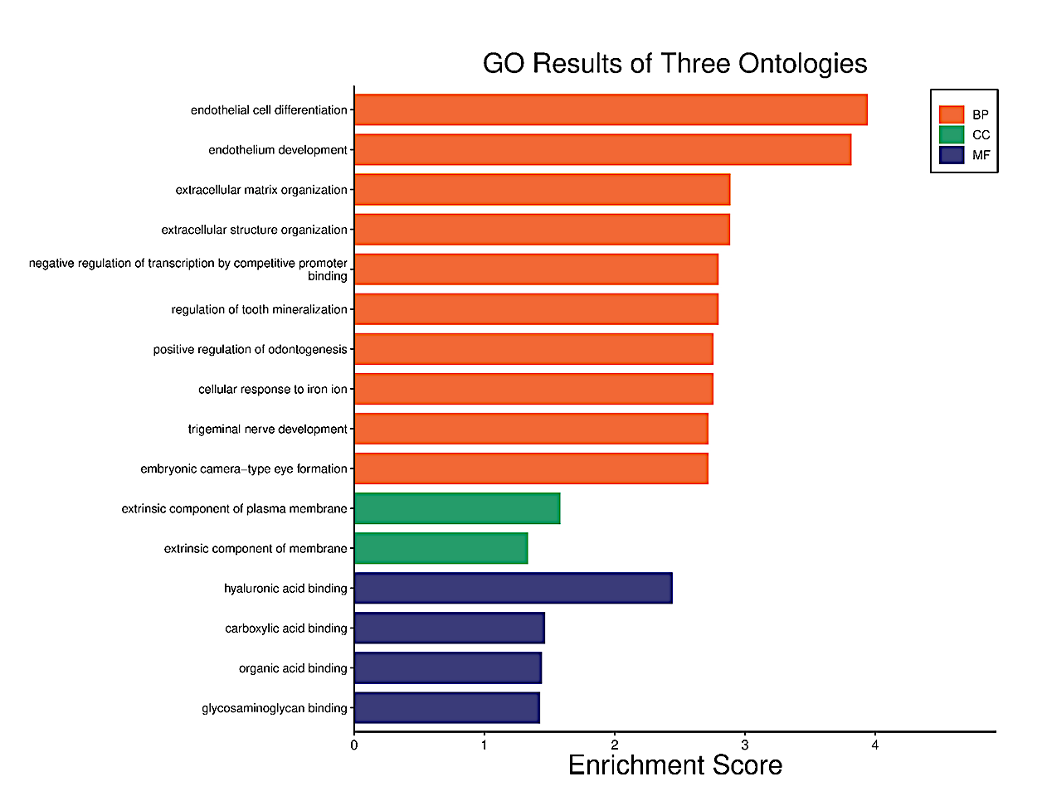
Figure 6a. Functional characteristics analysis for the AD-related DEGs: GO enrichment results of three ontologies. The orange indicates biological processes while the green indicates cellular components and the purple represents molecular functions
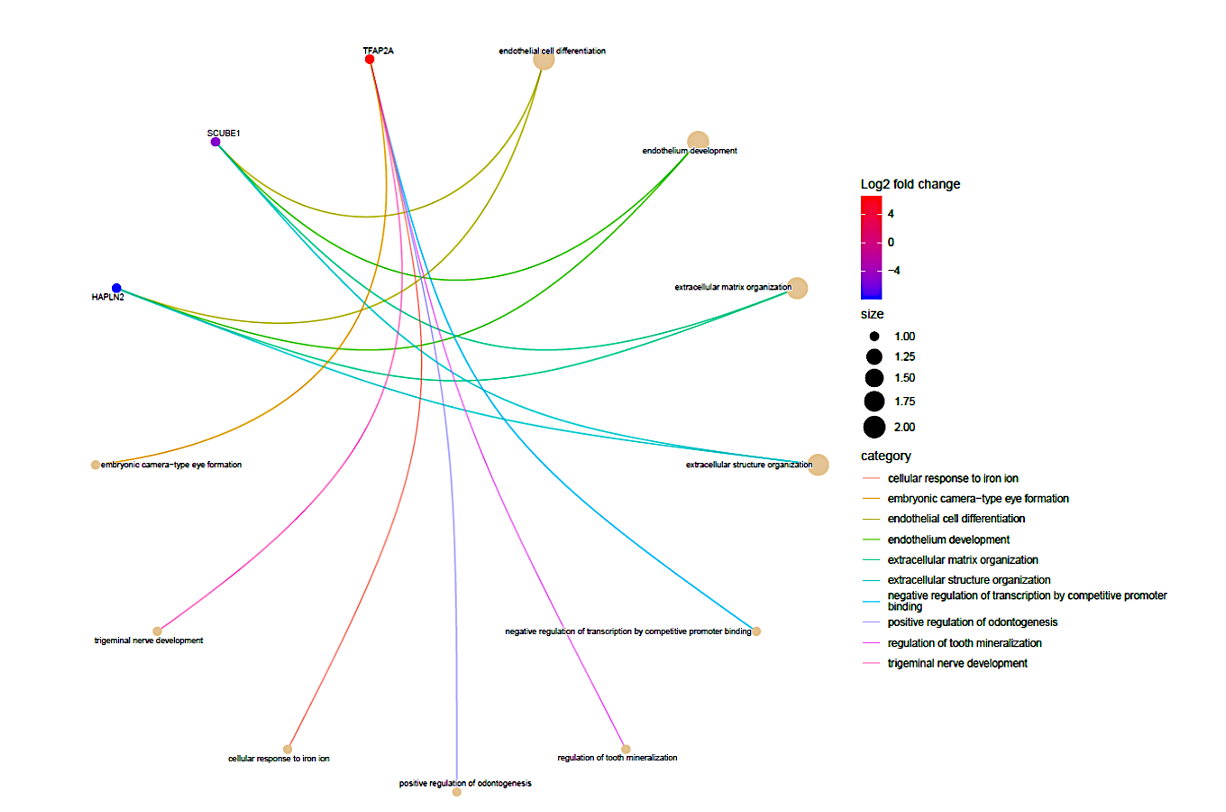
Figure 6b. Functional characteristics analysis for the AD-related DEGs: The Biological Process (BP) category of GO enrichment analysis. The nodes (dots) at the tip of the lines indicate genes. The genes with high log2 fold change are red while those with the lowest log2 fold change are blue in color. These genes were further analyzed to determine their association with T2D.
T2D GO analysis results show the three ontologies (Figure 7a), biological process (BP) (Figure 7b), which contains vitamin transport, animal organ regeneration, digestive system process; cellular components (CC) (Figure S4a), which involved platelet alpha granule, platelet alpha granule lumen, brush border; molecular functions (MF) (Figure S4b), such as vitamin transmembrane transporter activity, growth factor activity and organic anion transmembrane transporter activity. KEGG Pathway (Figure S4c and S4d) included vitamin digestion and absorption, maturity onset diabetes of the young and Antifolate resistance. Among the significant enrichment pathways were the renal cell carcinoma and prolactin signaling pathways which indicate the potential connection between T2D and AD.
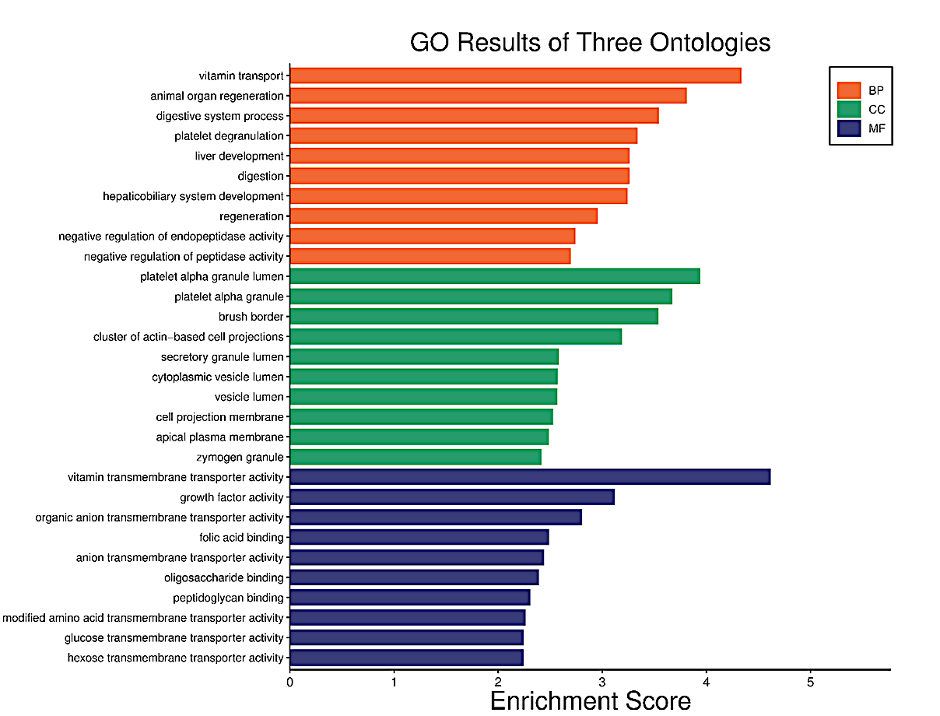
Figure 7a. Functional characteristics analysis for the T2D-related DEGs: GO enrichment results of three ontologies. The orange indicates biological processes while the green indicates cellular components and the purple represents molecular functions.

Figure 7b. Functional characteristics analysis for the T2D-related DEGs: The Biological Process (BP) category of GO enrichment analysis. The nodes (dots) at the tip of the lines indicate genes. The genes with high log2 fold change are red while those with the lowest log2 fold change are blue in color. These genes were further analyzed to determine their association with AD.
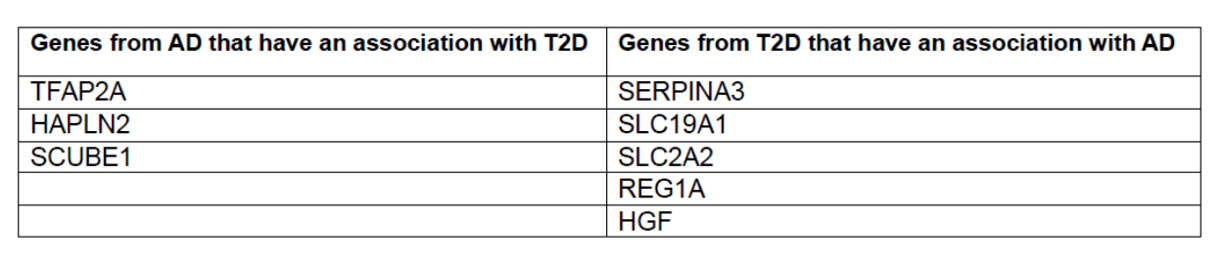
Finally, after examining all the outcomes of Gene Ontology (GO) and Kyoto Encyclopedia of Genes and Genomes (KEGG) analyses for both Alzheimer’s disease (AD) and type 2 diabetes (T2D) (Figures 4-7), a total of eight genes exhibiting potential associations with both conditions were identified and subsequently shortlisted (Table 1). Specifically, the genes SLC19A1, SLC2A2, SERPINA3, REG1A, and HGF from T2D showed to have an association with Alzheimer’s. While, genes TFAP2A, HAPLN2, and SCUBE1 from AD showed an association with Type 2 diabetes (Table 1).
Table 1: Genes from AD and T2D that have an association with each other.
SUPPLEMENTARY DATA
Supplementary 1: R Script used to generate DEG results using GEO2R bioinformatics tool
R script for T2D Dataset 20966
Supplementary 2: Excel sheet showing results of the chosen top 40 DEGs for both AD and T2D that are statistically significant based on ∣logFC | ≥ 1 and P < 0.05.
(a) Top 20 AD DEGs
(c) Top 8 AD and T2D Genes that have association with each other
SUPPLEMENTARY FIGURES
Supplementary Figure 1 AD First GO and KEGG
Supplementary Figure 2 T2D First GO and KEGG
Supplementary Figure 3 AD Second GO and KEGG
Supplementary Figure 4 T2D First GO and KEGG
DISCUSSION
The increasing worldwide prevalence of Alzheimer’s disease (AD) and Type 2 Diabetes (T2D) has caused significant health challenges and impacted healthcare costs (Moheet et al, 2015; Chung and Lee, 2021). Despite being seen as separate conditions, numerous studies have indicated a potential link between AD and T2D due to shared risk factors and effects on cognitive or thinking function, and brain structure (Moran et al, 2013; Moheet et al, 2015; Miles and Roof, 1922; Biessels, 2006; Rojas et al, 2021). In fact some research has proposed the term “type 3 diabetes” for Alzheimer’s disease ( Kandimalla, Thirumala & Reddy (2017; Mittal, Mani & Katare (2016). However, the exact genetic or molecular relationship between AD and T2D is still under exploration. While some studies have identified certain genes that potentially link these two conditions, it is possible that there are other genes, not yet discovered. Therefore, the goal of this study was to determine novel genes or molecular markers that potentially connect AD with type 2 diabetes.
To achieve this, we used various bioinformatics tools and databases namely, NCBI, GEO, SR Plot, GO, and KEGG to identify potential genes shared between AD and T2D. Our findings suggest that specific genes and pathways are potentially commonly implicated in biological processes and molecular functions of both AD and T2D.
Using NCBI and GEO2R, we identified differentially expressed genes (DEGs) in AD and T2D (Figures 2-3). I then used statistics to shortlist the DEGs to 10 up-regulated genes and 10 down-regulated genes for each condition (Supplementary 2a). The GO and KEGG analysis of the functional features of the common DEGs revealed significant biological processes and molecular functions shared between AD and T2D (Figures 4-7). For example, the GO analysis for AD highlighted extracellular matrix organization, endothelial cell differentiation, and hyaluronic acid binding, among others (Figure 4). On the other hand, the GO analysis for T2D pointed to significant processes such as vitamin transport, digestive system function, and growth factor activity (Figure 5). Additionally, the KEGG pathway analysis for both AD and T2D provided insights into the potential connection between these diseases, indicating pathways such as vitamin digestion and absorption, maturity onset diabetes of the young, and antifolate resistance (Figure 4-7).
The overlap of several pathways, including renal cell carcinoma and prolactin signaling (Figure 4-5), further supports the potential interplay between AD and T2D. These pathway results suggest that there are potential shared mechanisms that contribute to the development and progression of both diseases.
Finally, based on the GO and KEGG analysis results for AD and T2D (Figures 4 – 7) , the genes that had potential connection to both AD and T2D were shortlisted (Table 1). Specifically, TFAP2A, SCUBE1, HAPLN2 from AD have an association with T2D, while the genes SERPINA3, REG1A, HGF, SLC19A1, and SLC2A2 from T2D have an association with AD (Table 1). These identified genetic markers provide a starting point for future research and potential clinical interventions targeting the complex relationship between AD and T2D.
Limitations
However the lack of availability of many studies that show significant DEGs for AD and T2D limited our study to only two GEO datasets (Figure 2 – 3). Further, because this study uses bioinformatics data (tools and databases) derived from microarray laboratory experiments performed by other researchers, further validation of these genes is needed in a laboratory or clinical setting. Likewise, further study is needed to determine whether these genes are beneficial for clinical assessment.
Conclusion
Several bioinformatics tools and databases showed potential shared genes, biological processes, molecular functions and pathways that contribute to the development and progression of AD and T2D. We identified 3 genes; TFAP2A, SCUBE1, HAPLN2 from AD that have an association with T2D, as well the 5 genes SERPINA3, REG1A, HGF, SLC19A1, and SLC2A2 from T2D that have an association with AD. These eight genes serve as potential genetic biomarkers that can potentially contribute to the development of treatment strategies capable of addressing both AD and T2D at the same time.
The findings of this study lay the groundwork for further research in a laboratory and clinical setting to investigate the molecular interactions and pathways that contribute to the complex relationship between AD and T2D. The insights provided by this study have the potential to drive the development of new treatment interventions that could significantly improve patient outcomes and quality of life for individuals affected by both AD and T2D.
References
Adeghate E, Schattner P, Dunn E. An update on the etiology and epidemiology of diabetes mellitus. Ann N Y Acad Sci. 2006;1084:1–29. [PubMed] [Google Scholar]
Ali O. Genetics of type 2 diabetes. World J Diabetes. 2013 Aug 15;4(4):114-23. doi: 10.4239/wjd.v4.i4.114. PMID: 23961321; PMCID: PMC3746083.
Alzheimer’s Association. 2023 Alzheimer’s Disease Facts and Figures. Alzheimers Dement 2023;19(4). DOI 10.1002/alz.13016.
Chung Y, Lee H. Correlation between Alzheimer’s disease and type 2 diabetes using non-negative matrix factorization. Scientific Reports. 2021;11:15265. doi: 10.1038/s41598-021-94048-0. [PMC free article] [PubMed] [CrossRef] [Google Scholar]
Anjum A, Jaggi S, Varghese E, Lall S, Bhowmik A, Rai A. Identification of Differentially Expressed Genes in RNA-seq Data of Arabidopsis thaliana: A Compound Distribution Approach. J Comput Biol. 2016 Apr;23(4):239-47. doi: 10.1089/cmb.2015.0205. Epub 2016 Mar 7. PMID: 26949988; PMCID: PMC4827276.
Arnold SE, Arvanitakis Z, Macauley-Rambach SL, Koenig AM, Wang H-Y, Ahima RS, Craft S, Gandy S, Buettner C, Stoeckel LE, Holtzman DM, Nathan DM. Brain insulin resistance in type 2 diabetes and Alzheimer disease: concepts and conundrums. Nature Reviews. Neurology. 2018;14:168–181. doi: 10.1038/nrneurol.2017.185. [PMC free article] [PubMed] [CrossRef] [Google Scholar]
Barbagallo M, Dominguez LJ. Type 2 diabetes mellitus and Alzheimer’s disease. World J Diabetes. 2014 Dec 15;5(6):889-93. doi: 10.4239/wjd.v5.i6.889. PMID: 25512792; PMCID: PMC4265876
Barrett T, Wilhite SE, Ledoux P, Evangelista C, Kim IF, Tomashevsky M, Marshall KA, Phillippy KH, Sherman PM, Holko M, Yefanov A, Lee H, Zhang N, Robertson CL, Serova N, Davis S, Soboleva A. NCBI GEO: archive for functional genomics data sets—update. Nucleic Acids Research. 2013;41:D991–D995. doi: 10.1093/nar/gks1193. [PMC free article] [PubMed] [CrossRef] [Google Scholar]
Basu, R. (2017, May). Type 2 Diabetes . National Institute of Diabetes and Digestive and Kidney Diseases. https://www.niddk.nih.gov/health-information/diabetes/overview/what-is-diabetes/type-2-diabetes
Bertram L, Tanzi RE. Alzheimer’s disease: one disorder, too many genes? Hum Mol Genet 2004;Special No. Bertram L, Tanzi RE. Alzheimer’s disease: one disorder, too many genes? Hum Mol Genet 2004;Special No. 1:R135-R141.;Google Scholar
Biessels GJ. Risk of dementia in diabetes mellitus: a systematic review. 2006 Lancet Neurology The. 5:64–74. [PubMed] [Google Scholar]
Bobinski M, de Leon M.J. , Wegiel J, Desanti S, Convit A, Saint Louis L.A., Rusinek H, Wisniewski H.M,The histological validation of post mortem magnetic resonance imaging-determined hippocampal volume in Alzheimer’s disease. Neuroscience, 95 (2000), pp. 721-725
Breijyeh Z, Karaman R. Comprehensive Review on Alzheimer’s Disease: Causes and Treatment. Molecules. 2020 Dec 8;25(24):5789. doi: 10.3390/molecules25245789. PMID: 33302541; PMCID: PMC7764106.
Centers for Disease Control and Prevention. “National Diabetes Statistics Report, 2020: Estimates of Diabetes and Its Burden in the United States. National Diabetes Statistics Report, 2020: Estimates of Diabetes and Its Burden in the United States. Accessed 15 October 2020.”
Cacace, Sleegers & Van Broeckhoven (2016) Cacace R, Sleegers K, Van Broeckhoven C. Molecular genetics of early-onset Alzheimer’s disease revisited. Alzheimer’s & Dementia. 2016;12:733–748. [PubMed] [Google Scholar]
De-Paula V.J., Radanovic M., Diniz B.S., Forlenza O.V. Alzheimer’s disease. Sub-Cell. Biochem. 2012;65:329–352. doi: 10.1007/978-94-007-5416-4_14. [PubMed] [CrossRef] [Google Scholar] [Ref list]
Edgar, R., Domrachev, M., & Lash, A. E. (2002). Gene Expression Omnibus: NCBI gene expression and hybridization array data repository. Nucleic Acids Research, 30(1), 207–210. https://www.ncbi.nlm.nih.gov/pmc/articles/PMC99122/
Eid, A., Mhatre, I., & Richardson, J. R. (2019). Gene-environment interactions in Alzheimer’s disease: A potential path to precision medicine. Pharmacology & Therapeutics, 199, 173–187. https://doi.org/10.1016/j.pharmthera.2019.03.005
“Home – GEO – NCBI.” Nih.gov, 2019, www.ncbi.nlm.nih.gov/geo/
GEO2R – GEO – NCBI. (n.d.).www.ncbi.nlm.nih.gov. Retrieved October 27, 2023, from http://www.ncbi.nlm.nih.gov/geo/geo2r/
GEO Overview – GEO – NCBI. (n.d.). www.ncbi.nlm.nih.gov. https://www.ncbi.nlm.nih.gov/geo/info/overview.html
Kandimalla R, Thirumala V, Reddy PH. Is Alzheimer’s disease a type 3 diabetes? A critical appraisal. Biochimica Et Biophysica Acta (BBA)-Molecular Basis of Disease. 2017;1863:1078–1089. [PMC free article] [PubMed] [Google Scholar]
Lars Bertram, M.D., Mikko Hiltunen, Ph.D., Michele Parkinson, B.S.,Martin Ingelsson, M.D., Christoph Lange, Ph.D., Karunya Ramasamy, B.S., Kristina Mullin, B.S., Rashmi Menon, B.S., Andrew J. Sampson, B.A., Monica Y. Hsiao, B.S., Kathryn J. Elliott, M.S., Gonül Velicelebi, Ph.D., Thomas Moscarillo, B.A., Bradley T. Hyman, M.D., Steven L. Wagner, Ph.D.,K. David Becker, Ph.D., Deborah Blacker, M.D., Sc.D. and Rudolph E. Tanzi, Ph.D. Family-Based Association between Alzheimer’s Disease and Variants in UBQLN1. N Engl J Med 2005; 352:884-894 DOI: 10.1056/NEJMoa042765
Li, Song & Leng (2015) Li X, Song D, Leng SX. Link between type 2 diabetes and Alzheimer’s disease: from epidemiology to mechanism and treatment. Clinical Interventions in Aging. 2015;10:549. doi: 10.2147/CIA.S74042. [PMC free article] [PubMed] [CrossRef] [Google Scholar]
Marselli L, Thorne J, Dahiya S, Sgroi DC et al. Gene expression profiles of Beta-cell enriched tissue obtained by laser capture microdissection from subjects with type 2 diabetes. PLoS One 2010 Jul 13;5(7):e11499. PMID: 20644627
Mayeux & Stern (2012) Mayeux R, Stern Y. Epidemiology of Alzheimer disease. Cold Spring Harbor Perspectives in Medicine. 2012;2:a006239. [PMC free article] [PubMed] [Google Scholar]
McQueen, J. (2021, June 21). Type 2 Diabetes: How Does Race Make a Difference? WebMD. https://www.webmd.com/diabetes/type-two-diabetes-race
Miles WR, Root HF. Psychologic tests applied to diabetic patients. Arch Intern Med. 1922;30:767–777. [Google Scholar]
Mittal K, Mani RJ, Katare DP. Type 3 diabetes: cross talk between differentially regulated proteins of type 2 diabetes mellitus and Alzheimer’s disease. Scientific Reports. 2016;6:1–8. [PMC free article] [PubMed] [Google Scholar]
Moheet, Mangia & Seaquist (2015) Moheet A, Mangia S, Seaquist E. Impact of diabetes on cognitive function and brain structure. Annals of the New York Academy of Sciences. 2015;1353:60–71. doi: 10.1111/nyas.12807. [PMC free article] [PubMed] [CrossRef] [Google Scholar]
Moran C, Phan TG, Chen J, et al. Brain Atrophy in Type 2 Diabetes Regional distribution and influence on cognition. Diabetes Care. 2013;36:4036–4042. [PMC free article] [PubMed] [Google Scholar]
Munna, M. T. A., Alam, M. M., Allayear, S. M., Sarker, K., & Ara, S. J. F. (2019). Prediction Model for Prevalence of Type-2 Diabetes Complications with ANN Approach Combining with K-Fold Cross Validation and K-Means Clustering. Lecture Notes in Networks and Systems, 1031–1045. https://doi.org/10.1007/978-3-030-12388-8_71
Naughton B. J., Duncan F. J., Murrey D. A., Meadows A. S., Newsom D. E., Stoicea N., et al.. (2015). Blood genome-wide transcriptional profiles reflect broad molecular impairments and strong blood-brain links in Alzheimer’s disease. J. Alzheimers Dis. 43, 93–108. doi: 10.3233/JAD-140606, PMID: [PMC free article] [PubMed] [CrossRef] [Google Scholar]
Rojas M, Chávez-Castillo M, Bautista J, Ortega Á, Nava M, Salazar J, Díaz-Camargo E, Medina O, Rojas-Quintero J, Bermúdez V. Alzheimer’s disease and type 2 diabetes mellitus: Pathophysiologic and pharmacotherapeutics links. World J Diabetes. 2021 Jun 15;12(6):745-766. doi: 10.4239/wjd.v12.i6.745. PMID: 34168725; PMCID: PMC8192246.
Saunders AM, Strittmatter WJ, Schmechel D, et al. Association of apolipoprotein E allele epsilon 4 with late-onset familial and sporadic Alzheimer’s disease. Neurology 1993;43:1467-1472
SRplot- Science and Research online plot. (n.d.). www.bioinformatics.com.cn. Retrieved October 27, 2023, from http://www.bioinformatics.com.cn/srplot
Tuomi, Tiinamaija. “Type 1 and type 2 diabetes: what do they have in common?.” Diabetes 54.suppl_2 (2005): S40-S45.
Ye XW, Liu MN, Wang X, Cheng SQ, Li CS, Bai YY, Yang LL, Wang XX, Wen J, Xu WJ, Zhang SY, Xu XF, Li XR. Exploring the common pathogenesis of Alzheimer’s disease and type 2 diabetes mellitus via microarray data analysis. Front Aging Neurosci. 2023 Feb 27;15:1071391. doi: 10.3389/fnagi.2023.1071391. PMID: 36923118; PMCID: PMC10008874.
Zhong M, Wu Y, Ou W, Huang L, Yang L. Identification of key genes involved in type 2 diabetic islet dysfunction: a bioinformatics study. Biosci Rep. 2019 May 31;39(5):BSR20182172. doi: 10.1042/BSR20182172. PMID: 31088900; PMCID: PMC6542763
Ye, X., Liu, M., Wang, X., Cheng, S., Li, C., Bai, Y., Yang, L., Wang, X., Wen, J., Xu, W., Zhang, S., Xu, X., & Li, X.-R. (2023). Exploring the common pathogenesis of Alzheimer’s disease and type 2 diabetes mellitus via microarray data analysis. Frontiers in Aging Neuroscience, 15. https://doi.org/10.3389/fnagi.2023.1071391
Ye, X., Liu, M., Wang, X., Cheng, S., Li, C., Bai, Y., Yang, L., Wang, X., Wen, J., Xu, W., Zhang, S., Xu, X., & Li, X.-R. (2023). Exploring the common pathogenesis of Alzheimer’s disease and type 2 diabetes mellitus via microarray data analysis. Frontiers in Aging Neuroscience, 15. https://doi.org/10.3389/fnagi.2023.1071391
Zhong, M., Wu, Y., Ou, W., Huang, L., & Yang, L. (2019). Identification of key genes involved in type 2 diabetic islet dysfunction: a bioinformatics study. Bioscience Reports, 39(5). https://doi.org/10.1042/bsr20182172
Zhu, H., Zhu, X., Liu, Y., Jiang, F., Chen, M., Cheng, L., & Cheng, X. (2020). Gene Expression Profiling of Type 2 Diabetes Mellitus by Bioinformatics Analysis. Computational and Mathematical Methods in Medicine, 2020, 1–10. https://doi.org/10.1155/2020/9602016

