Using Bioinformatics to Investigate the Effect of Sepsis-Causing Bacteria on Gene Expression

ABSTRACT
Sepsis is a life threatening condition caused by an organism’s overreaction to foreign invaders, resulting in serious medical complications such as organ failure. While sepsis research has been progressing, there remains an abundance of complications stopping scientists from fully understanding the disease. First of all, sepsis can be caused by a variety of microbes ranging from bacteria to virus to parasites. Additionally, gene expression data in sepsis patients has been known to be difficult to extract. Although sepsis can be treated on a patient-by patient basis, creating general treatments and cures have proven difficult and complicated. This study therefore aims to study a specific branch of sepsis caused by gram-positive bacteria such as Escherichia coli and Staphylococcus aureus. In this study, gene expression data is compared between infected sepsis patients and healthy donors to see what pathways and functions are expressed differently in patients suffering from bacterial sepsis. This knowledge can lay the groundwork for future studies that attempt to find treatment methods to bacterial sepsis that take advantage of the differentially expressed genes. Our results indicate that bacterial sepsis causes changes in expression of key genes, CMA1, CRHR2 and TUBB1/2 and that these genes are enriched or associated in functions and biological pathways of negative viral regulation, peptide bonding, and cytoskeletal structure. Therefore, scientists can potentially use these genes to further understand bacterial sepsis and potentially develop targeted, life-saving treatments to improve outcomes.
INTRODUCTION
Sepsis is an extremely dangerous medical condition which results from the body’s overreaction to an infection which can lead to a loss of organ function. This can lead to life threatening complications such as shock, organ failure, and death (WHO 2024). Although sepsis can be caused by a variety of pathogens, the primary cause of sepsis is due to bacteria (WHO 2024). The goal of this paper is to investigate how bacteria cause sepsis in the body with regard to their impact on gene expression. Sepsis-causing bacteria have distinct toxins that they release, which many believe to be the source of sepsis. Some of these toxins include endotoxins and superantigens (Sizar et. al 2023). The most common cause of sepsis is due to gram-positive bacteria such as Staphylococcus aureus (S. aureus), Streptococcus pyogenes (S. pyogenes), Klebsiella spp. Escherichia coli (E. coli), and Pseudomonas aeruginosa (P. aureginosa) (Ramachandran et. al 2014). Gram-positive bacteria are known for their thicker peptidoglycan cell wall and can be found through a special dying technique which leaves gram-positive bacteria blue (Sizar et. al 2023). Patients with sepsis are seen to have high levels of Heat Shock gene expression although those seem to be from the bacteria themselves rather than the host (Shao et. al 2023). Additionally, gene expression does appear to be different in patients with sepsis, but unfortunately the specifics remain unclear. It is quite difficult to study sepsis at a populational level (WHO 2024) as gene expression varies greatly from one sepsis patient to another. Moreover, gene expression changes at a rapid rate in patients with sepsis, making it hard to diagnose anything (Maslove et. al 2014).
Therefore, to address these challenges, the goal of this research was to see if bacteria causes sepsis through changes in gene activity. Since sepsis is described as an extreme reaction, the initial hypothesis was that the bacteria triggers too much gene activity or gene expression in the host organism, leading to this overreaction. This research is important because if the gene regulation behind bacterial sepsis is understood, better treatments can be created that target the specific genes affected by sepsis, potentially saving millions of lives.
METHODS
Obtaining Biological Data sets from NCBI Bioinformatics Database
There is currently an abundance of biological data, but much of it remains unanalyzed. The National Center for Biotechnology Information (NCBI), a part of the National Institute of Health, is one of many websites storing this data (https://www.ncbi.nlm.nih.gov/)., also known as NCBI, One of the main features of NCBI is its collections of databases and analysis tools which allows researchers to obtain and analyze data (Wojcikiewicz 2016). One such database, the Gene Expression Omnibus (GEO), contains experiments on gene expression using RNA or DNA biological molecules (Barret et al, 2009). GEO is freely accessible at http://www.ncbi.nlm.nih.gov/geo/ for public use (Barret et al, 2009).
In this research, the GEO dataset identified and collected was GSE210797, which can be found on its website (GEO). GSE210797 reports the gene transcription levels through blood samples of nonviral sepsis patients, in addition to those of healthy donors (Campbell et. al 2022). Gene transcription levels are then compared with one another to figure out how bacteria affect gene expression levels in non viral sepsis.
Analyzing data with GEO2R Bioinformatics Tool
The gene expression omnibus is a database belonging to the NCBI that contains microarray data regarding gene expression which can further be analyzed by the GEO2R bioinformatics tool (Barret et al, 2009; Mohammad 2022). Instead of manually writing codes or programming, GEO2R uses artificial intelligence and machine learning algorithms using the R programming language to help users find differentially expressed genes within the data (Milian 2024). Using the dataset GSE210797, the samples were organized into two categories: infected patients and healthy donors. The data was then analyzed with GEO2R to see trends in the data. The algorithms used to generate the dataset GSE210797 dataset identified and used in this study are indicated in the supplementary results (R Script). The greatest increases and decreases in gene expression were recorded in scatter and box plots to examine any distinct clusters forming between the two groups (Figure 1).
Statistically Sorting and Selecting Differentially Expressed Genes
The information given from GEO2R collected around 15000 differentially expressed genes (DEGs) (Figure 3), which was then screened and limited to around 40 genes. First, insignificant data was removed by p-value. When setting a threshold of p ≤ 0.01 the gene pool was narrowed to a few hundreds. Afterwards, the top 20 up and downregulated genes are selected based on the log2fold change (|log2(fold change)|>1), giving 40 genes to work with (Supplementary Results: Top DEGs)
Finding Biological Functions and Pathway Trends Between Differentially Expressed Genes With SR Plot
To determine which functions and biological pathways are linked to certain genes, the data was analyzed using SR Plot, another bioinformatics tool (https://www.bioinformatics.com.cn/en). Gene Ontology (GO) terms (Ashburner et al, 2000) and KEGG bioinformatics databases were used to locate gene function and pathways. GO terms include biological process (BP), cellular component (CC), and molecular function (MF) (Ashburner et al, 2000). Using SR Plot (https://www.bioinformatics.com.cn/en), gene data from GEO2R was analyzed to see what similarities exist between the differentially expressed genes. In this present study, the top differentially expressed genes (DEGs) were chosen and analyzed using the SR Plot bioinformatics database to perform GO and KEGG pathway enrichment analysis. Figure 1 summarizes the workflow of the methods used in this research study.
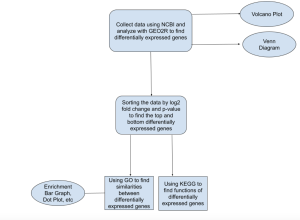
Figure 1. Research Outline: General outline of methods used throughout this research study. First, NCBI and GEO2R were used to analyze differentially expressed genes with non-viral sepsis. Afterwards, the data was sorted, mainly based on p-value ≤ 0.01, but also keeping in mind the log2 fold change change (log2(fold change)|>1), in order to find the most significant genes expressed. Afterwards, SR plot was used to conduct a gene ontology analysis and found trends regarding biological process, molecular function, and cellular component between the differentially expressed genes. At the same time, KEGG bioinformatics database was used to find pathways shared between the differentially expressed genes.
RESULTS
Top Differentially Expressed Gene (DEG) Identification
A differentially expressed gene (DEG) represents a gene whose observed change in expression is deemed significant enough based on the gene p-value (Anjum et. al 2016). GEO2R accesses the gene expression data and finds the differentially expressed genes using a volcano plot (Figure 2) and venn diagram (Figure 3). Afterwards, the top up and down DEGs were identified using a p-value threshold of 0.01 and |log2(fold change)|>1 (Supplementary Results: Top DEGs).
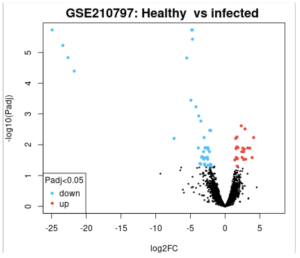
Figure 2. Volcano Plot of Healthy vs Infected Patients: GEO2R was used to analyze the genes affected by non viral sepsis. In the red are the genes whose expression increased in patients with non-viral sepsis, and in the blue are in genes whose expression is decreased in patients with non-viral sepsis. Black dots show genes that had no difference in expression between patients and healthy individuals. As shown above, there are around 60 genes that are either up or downregulated.
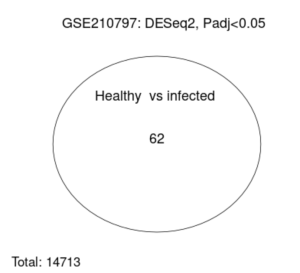
Figure 3. Venn Diagram of Healthy vs Infected Patients: The total number of genes analyzed by GEO2R was 14713. But between the healthy and infected patients, the number of genes whose expression is different between infected and healthy patients was 62 significantly affected genes in patients with non viral sepsis.
SR Plot was further used in order to visualize the differences in gene expression in terms of log fold change for the top DEGs (Figure 4). The results of the top DEGs highlight the top genes with the most significant increase and decrease in expression, measured by log2 fold change. Results here show that the genes TMSB4Y, EIFIAY, RPS4YI, and UTY exhibit the highest levels of gene expression (Figure 4).
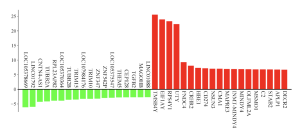
Figure 4. Up and Downregulated Genes: This figure shows the top genes with the greatest increase in expression and genes with reduced expression according to log2 fold change. In the red are the genes whose expression increased in patients with non-viral sepsis, and in the green are the genes whose expression is decreased in patients with non-viral sepsis.The main genes to focus on here would be TMSB4Y, EIFIAY, RPS4YI, and UTY because they have the greatest gene expression.
Identification of Potential Functions of Top Genes using Gene Ontology Bioinformatics Database
After identifying the top DEGs (Supplementary Results: Top DEGs), the data was analyzed using the gene ontology (GO) bioinformatics database on SR Plot bioinformatics tool (https://www.bioinformatics.com.cn/enin) to find the specific functions or pathways that are enriched or associated with the DEGs as well as the most important genes to analyze. First, the data was sorted by Gene Ontology (GO) terms (Ashburner et al., 2000) bioinformatics database to see whether bacterial sepsis targeted biological process (BP), cellular component (CC), and/or molecular function (MF) (Ashburner et al., 2000).Although all three categories had somewhat similar enrichment scores (Figure 4), the main focus seemed to be on BP and MF. Afterwards, the functions and genes regulated were studied in regards to BP and MF using dot plots and CNet charts (Figure 5, 6 and 7).
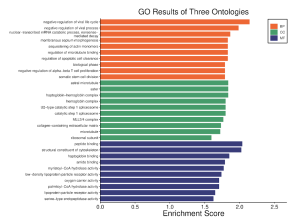
Figure 4. Gene Enrichment Chart: This figure shows the enrichment scores of the top and bottom regulated genes. In the orange are the biological processes results, in the green are the cellular component results, and in the blue are the molecular function results. The above figure shows that sepsis causing bacteria has effects mainly on biological processes and molecular function with the main areas of enrichment being negative regulation of viruses, peptide binding, and cytoskeletal structure.
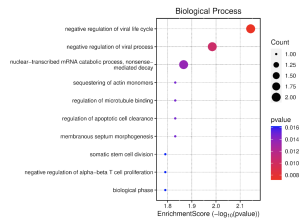
Figure 5. Biological Process Dot Plot: This figure shows the highest enrichment and most expressed biological processes in humans with bacterial sepsis. It seems that the most important processes here relate to the negative regulation of viruses who have higher counts and enrichment scores. The negative regulation of the viral life cycle should be highlighted as it also has a lower p-value than the other processes, making that data the most reliable.
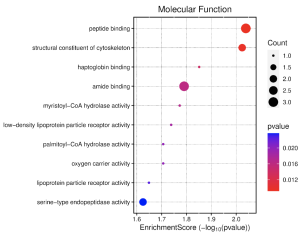
Figure 6. Molecular Function Dot Plot: This figure shows the highest enrichment and most expressed functions in humans with bacterial sepsis. Dots that are more red are most statistically significant, and higher enrichment scores indicate bigger changes in expression. It seems that the most important functions here are peptide binding and cytoskeleton structure as those processes have high enrichment and count values, as well as having lower p-values.
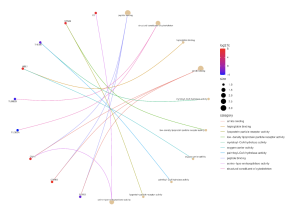
Figure 7. MF CNet Plot: This figure shows the correlation between differentially expressed genes and molecular function in an organism. Genes in red were upregulated while the genes in blue were downregulated. In this case, the important genes are C2 (linked to serine-type endopeptidase activity) , STAB2 (linked to lipoprotein receptor activity), HBE1 (linked to oxygen carrying and haptoglobin binding), CMA1 (linked to serine-type endopeptidase activity, peptide binding, and amide binding), and CRHR2 (linked to peptide binding and amide binding) as they are all significantly upregulated. Additionally, TUBB2A and TUBB2B are both significantly downregulated genes which are both connected to cytoskeletal structure.
Table 1. Summary of Key Genes Identified for Further Research
| KEY GENES FOR FURTHER RESEARCH | |
GENE NAME | ASSOCIATED FUNCTIONS AND BIOLOGICAL PATHWAY |
CMA1 | Peptide Binding – Produces peptides that are used for gland secretion, blood pressure monitoring, and the degradation of the extracellular matrix. |
CRHR2 | Peptide Binding – Enables hormone activity and acts in many cell signaling pathways |
TUBB2A | Cytoskeletal Structure – Encodes beta tubulin |
TUBB2B | Cytoskeletal Structure – Encodes beta tubulin |
Table 1. Summary of Key Identified Genes: This table highlights and summarizes the genes whose regulation was deemed the most important in non viral sepsis. A focus here was put on molecular function as the highest regulated genes found with regard to biological processes did not align with the top biological processes (see supplementary data).
DISCUSSION
Sepsis is a highly dangerous disease which is caused from the overreaction of the body to foreign pathogens and diseases (WHO 2024). One of these causes is gram-positive bacteria such as E. Coli and S. Aureus (Ramachandran 2014). There existed many unknowns on how these bacteria actually caused sepsis in humans through changes in gene expression. Using NCBI, GEO2R, SR Plot, GO and KEGG bioinformatics databases and tools (Figure 1), 62 genes were identified that were differentially expressed between healthy and infected individuals (Figures 2, 3 and 4), which were then studied to find the general areas and specific genes that were most affected by these bacteria (Figures 5, 6 and 7). In the end, the data suggested that these bacteria had the biggest effect on the biological processes and molecular functions of patients (Figures 4, 5 and 6). The specific processes that were the most affected were those involving the negative regulation of viruses (Figure 7). Meanwhile, the molecular functions impacted were peptide binding and cytoskeletal structure (Figure 6 and 7). When looking for the most impacted genes, attention should be drawn to CMA1 and CRHR2 (Figure 7 and Table 1) as they are genes which are greatly upregulated in bacterial sepsis patients and affect peptide binding, as well as TUBB2A and TUBB2B (Figure 7 and Table 1) due to their large down regulation in bacterial sepsis patients and correlation to cytoskeletal structure.
These results indicate that bacterial sepsis correlates to human gene expression, specifically in areas such as virus regulation, peptide binding, and cytoskeletal structure (Table 1). In the end, the hypothesis was partially proven as correlation between sepsis and gene regulation was shown. However, it failed to predict the actual genes and processes that were affected.
In terms of negative viral regulation, the data collected here matches those found in other studies. A literary review found a correlation between sepsis patients and an upregulation in pathogen recognition (Russell 2011). This aligns with the definition of negative viral regulation which is a process that stops the growth and reproduction of viruses within a host organism (GO) (Figure 4, 5 and 6).
Although there were not many previous connections found between sepsis and peptide bonding, there have been correlations drawn between sepsis and CR genes such as CRHR2. In a study done on mice, stress responses to sepsis have been linked to the release of the CRH hormone, suggesting an increased expression of genes such as CRHR2 (Gonzalez et al. 2008).
There has also been research relating sepsis to tubulin, which is produced by TUBB2A and TUBB2B and has major impacts on cytoskeletal structure (NIH 2019). Studies have analyzed HDAC6, a key gene in combating sepsis. One key aspect of HDAC6 is its activation of tubulin producing genes like TUBB2A/B (Zhang et al 2021). Further studies could observe if this activation of tubulin producing genes is in response to the down regulation of these genes by sepsis observed above.
The results from this research can be used as an effective treatment against sepsis as it gives us ideas on how to combat sepsis. Personalized medicine can be used in order to counteract some of the molecular function effects of sepsis. For example, treatments which take the role of HDAC6 and other tubulin producing factors can help combat against the down regulation of cytoskeletal structure genes. Additionally, treatments which can stop the expression of the up-regulated genes such as CRHR2 and CMA1 (Table 1) act as another way to fight sepsis. Additionally, these findings could help vaccine and antibiotic makers target specific genes to fight off bacterial sepsis.
In the case of many bioinformatics research, since the gene data is not being taken directly from human or bacterial samples, further studies were unable to be conducted regarding the genes affected by bacterial sepsis. In order to come up with a more practical solution, more laboratory and clinical work must be done. Additionally, the sample size of the dataset used was not the largest and further studies done on wider populations would be needed to confirm our results.
In the future, studies will need to be done observing bacterial sepsis on a populational level as well as laboratory work on the genes such as CRHR2, CMA1, and TUBB2A/B (Table 1) in order to study sepsis’s specific effect on these genes.
Conclusion
This bioinformatics study using NCBI, GEO2R, SR Plot, GO and KEGG (Figure 1) gives us more clues on how bacterial sepsis works and its impact on gene expression. The areas most affected by bacterial sepsis are the biological process of negative viral regulation and the molecular functions of peptide binding and cytoskeletal structure. In addition to those functions, the genes to be studied are CRHR2, CMA1, TUBB2A, AND TUBB2B (Table 1). These genes can be used by scientists in future studies to understand how their gene expressions contribute to bacterial sepsis and how researchers can potentially develop better treatments that target these specific genes.
References
Anjum, A., Jaggi, S., Varghese, E., Lall, S., Bhowmik, A., & Rai, A. (2016, April 1). Identification of differentially expressed genes in RNA-seq data of Arabidopsis thaliana: A compound distribution approach. Journal of computational biology : a journal of computational molecular cell biology.
Campbell, & Rondina. (2022, December 1). Series GSE210797. National Center for Biotechnology Information.
EMBL. (n.d.). Gene ontology and go annotations. QuickGO.
Wojtkiewicz, & P. Ciborowski. (2016). National Center for Biotechnology Information.
Maslove, D. M., & Wong, H. R. (2014, February 15). Gene expression profiling in sepsis: Timing, tissue, and translational considerations. Trends in molecular medicine.
Milian, R. G. (2024, May 2). Bioinformatics Thursdays – using GEO2R to quickly reanalyze public expression datasets: RNA-seq and microarrays (in-person). Yale School of Medicine.
Mohammad Yaseen Sofi, & Khalid Z. Masoodi. (2022). Gene expression omnibus. Gene Expression Omnibus – an overview | ScienceDirect Topics.
Ramachandran, G. (2013, November 5). Gram-positive and gram-negative bacterial toxins in sepsis: A brief review. PubMed Central (PMC).
Russell, J. A. (2011). Gene expression in human sepsis: What have we learned? Critical Care, 15(1), 121.
Shao, Q., Chen, D., Chen, S., Ru, X., & Ye, Q. (2023, November 27). escherichia coli infection sepsis: An analysis of specifically expressed genes and clinical indicators. Diagnostics (Basel, Switzerland).
Sizar, O., Leslie, S., & Unakal, C. G. (2023, May 30). Gram-positive bacteria. StatPearls [Internet].
SRplot. (n.d.). SRplot. https://www.bioinformatics.com.cn/en
Tanya Barrett, Dennis B. Troup, Stephen E. Wilhite, Pierre Ledoux, Dmitry Rudnev, Carlos Evangelista, Irene F. Kim, Alexandra Soboleva, Maxim Tomashevsky, Kimberly A. Marshall, Katherine H. Phillippy, Patti M. Sherman, Rolf N. Muertter, Ron Edgar, NCBI GEO: archive for high-throughput functional genomic data, Nucleic Acids Research, Volume 37, Issue suppl_1, 1 January 2009, Pages D885–D890
U.S. National Library of Medicine. (n.d.). National Center for Biotechnology Information. https://www.ncbi.nlm.nih.gov/
U.S. National Library of Medicine. (n.d.). TUBB2B gene: Medlineplus genetics. MedlinePlus.
World Health Organization. (2024, May 3). Sepsis. World Health Organization. https://www.who.int/news-room/fact-sheets/detail/sepsis
Xavier F. Gonzales, Aniket Deshmukh, Mark Pulse, Khaisha Johnson, & Harlan P. Jone. (2007, December 31). Stress-induced differences in primary and secondary resistance against bacterial sepsis corresponds with diverse corticotropin releasing hormone receptor expression by pulmonary cd11c+ MHC II+ and CD11C− MHC II+ apcs. Brain, Behavior, and Immunity.
Zhang, Q., Wang, Y., Qu, D., Yu, J., & Yang, J. (2021, February 25). Role of HDAC6 inhibition in sepsis‑induced acute respiratory distress syndrome (review). Experimental and Therapeutic Medicine.

