Integrating FOS-Mediated Transcriptional Dysregulation and PMAIP1/PERK-Dependent ER Stress Apoptosis as Potential Biomarkers for Tuberculosis Progression Risk Using Bioinformatics

Potential Biomarkers for Tuberculosis Progression Risk Using Bioinformatics - Guhan Ramanathan
ABSTRACT
Background
Mycobacterium tuberculosis is aerobically transmitted, obligate aerobic bacteria that is widely considered a global health crisis that affects nearly a quarter of the population and is the world’s deadliest infectious disease. Mycobacterium tuberculosis establishes dormancy in alveolar macrophages, remaining asymptomatic for years. It reactivates upon immune suppression, causing severe outcomes in HIV patients. Early signs of progression, response variability, and specific mechanisms remain unknown. The goal of this study is to investigate and propose biomarkers for early signs of progression from latent to active tuberculosis.
Methods
GEO2R, SR Plot, KEGG, and GO were used to find the top 50 differentially expressed genes (DEGs), visualize, and analyze them. GEO dataset GSE189996 was used to find DEGs. This dataset used human, alveolar macrophage samples from 28 donors to investigate DEGs associated with host response variability. Groups were defined as control versus infected from time periods of 2, 24, and 72 hours.
Results
50 DEGs were identified based on padj, p-value, and stat (Wald Statistic). Thirty were upregulated and 20 were downregulated (see figure 2). GO analysis indicated enrichment in the biological process ontology, and ER-stress-induced-apoptosis and RNA-transcription-dysregulation being the most enriched. KEGG analysis identified MAPK and TNF signaling pathways including TNF, FOS, SIRT1, KLF4, KLF5, HERPUD1, PMAIP1 (NOVA), and EIF2AK3 (PERK) were top genes and pathways.
Discussion
We propose that the biomarkers of increased SIRT1 expression and high KLF4:KLF5 as the most easily testable biomarkers of progression from latent to active tuberculosis due to being the upstream controllers of the proposed mechanisms.
INTRODUCTION
Tuberculosis (TB), caused by Mycobacterium Tuberculosis, continues to be a health crisis. Glaziou et al.1 states that nearly one quarter of the population worldwide has latent TB infection or will develop it, where the bacterium is dormant within the human body in a Ranke complex without symptoms and is not contagious. De Martino et al. [2] describe active tuberculosis as a curable, aerially transmittable disease which can create symptoms of coughing, fevers, pain in the chest, etc. They additionally state that the majority of people infected with Tuberculosis will have inactive tuberculosis, also known as latent or dormant tuberculosis; latent TB has no symptoms and can exist within a host for years before showing symptoms, making its progression unpredictable. In 2016, TB caused 1.3 million deaths and is the leading infectious disease and 10.4 million new cases arose [1].
Current tests like Tuberculosis Skin Test [3] and QuantiFERON [4] can detect exposure from TB, but the focus of this study is to identify progression risks from latent to active. In a clinical setting, QuantiFERON could identify latent TB and an intervention based on genes identified from this study could identify progression risks [4]. This fixes costly issues in public health systems where they are forced to either treat all latent TB individuals which risks overtreating those who won’t progress, side effects, and drug resistance or treat none which misses preventable deaths [5]. In this study, it is investigated which pathways or genes in early M. TB infection can be used to identify patients of high risk of progression to active disease from latent within a defined timeframe and if these pathways or genes be used for targeted therapies? Moreover, do these signatures reveal specific pathways or genes that could be intervened to prevent progression? Because of its obligate aerobic nature it infects the lungs which allows it to spread aerobically [2,6]. The lipid cell wall (mycolic acid) causes it to be acid-fast, which requires the Ziehl-Neelsen gram stain rather than normal techniques. Then, M. TB is a facultative intracellular organism, meaning it can live in other cells, and more specifically, macrophages. Its cord factor allows it to evade immune response, and catalase peroxidase will enable it to resist host cell oxidation. M. TB creates a TH-1 response which eventually leaves a Ghon complex, a.k.a the caseating tissue (earlier stage of Ranke complex). If M. TB gets reactivated due to immunorepressors, then it will eventually lead to bronchopneumonia or spread through the vascular system to other organs in the body [2,6].
Finally, M. TB is found through screening using a TB Skin test (active) or QuantiFERON (latent), and if it’s positive, then a Chest x-ray into a sputum sample staining for acid-fast bacilli [2,7].
Bioinformatics studies compare gene expression profiles using transcriptomics (RNA-seq) and they have identified distinct transcriptional signatures that can identify progression from latent to active TB. For example, Burel et al. [8] have identified blood transcriptomic signatures that can identify high risk latent TB individuals based on reactions to chemprophylaxis. These signatures usually find upregulated immune and inflammatory pathways which align with the TB skin test checking for size of induration [3,8]. While transcriptional signatures can stratify latent TB progression risk months to years before symptom onset, validated biomarkers currently exist to predict progression during the earliest stages of infection. Moreover, It is also unknown exactly how early these signatures can appear, how stable they are, or how influenced they are by other factors [2,6,9]. Additionally, distinguishing a real signature from unimpactful ones in longitudinal data; accounting for variation between patients, especially with TB; and translating complex multi-gene signatures into clinically available interventions can be extremely challenging. The goal of this study is to propose genetic mechanisms of infection in order to identify molecular signatures in the host which can be used to predict the progression within 72 hours of a latent M. TB infection which can allow for more precise interventions for individuals found as high-risk. I hypothesize that latent TB individuals who later progress to active disease will exhibit distinct gene expression profiles compared to stable non-progressors. This research addresses the limitations of what exists currently for TB patients and can possibly fix the inefficiency of current latent to active TB treatments overall reducing deaths and optimizing the use of limited healthcare resources by focusing on what is most immediately needed.
METHODS
In this study, the dataset Alveolar macrophage immunobiology and functional genomics: Unlocking human to human variation in host response to M. tuberculosis was collected from NCBI GEO2R10 by using the search details:
(“mycobacterium tuberculosis”[MeSH Terms] OR “Mycobacterium tuberculosis”[Organism] OR mycobacterium tuberculosis[All Fields]) AND (“macrophages, alveolar”[MeSH Terms] OR alveolar macrophages[All Fields])
Following figure 1, searching this will provide 396 results and the focus of this study was on result 18 (where 17 was a follow-up, replication study). Then the 124 samples from dataset GSE18999611 was defined or categorized into groups “mtb-2hr” AND “mtb-24hr” AND “mtb-72hr” AND “control-2hr” AND “control-24hr” AND “control-72hr.” They were then analyzed using the no-code GEO2R bioinformatics tool that uses R programming language in order to generate the venn diagram, volcano plot, and list of differentially expressed genes and finally input into SRPlot.
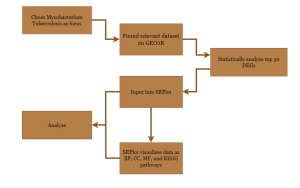
Figure 1: Research Methodology of the steps and bioinformatics used in this study. Research method workflow from data collection to functional analysis. Steps include dataset collection from NCBI GEO, differential gene expression analysis using GEO2R. Functional and pathway analysis of key genes was performed using SR Plot, integrating Gene Ontology (GO) and KEGG databases.
Identification of the Top Differentially Expressed Genes
To identify the most significant differentially expressed genes, statistical analysis was applied. This process used stat, p-value, and padj value to prioritize the most important genes out of 12381 based on their differential expression across samples. Prioritizing padj, stat, and p-value in that order. Stat being the Wald Statistic.
Data Analysis Using SRPlot, KEGG, and GO Bioinformatics Tools
Then SRPlot12, KEGG13, and GO14,15 bioinformatics tools and databases were utilized to analyze the functions of these top genes. These tools helped uncover the potential roles of the genes in Mycobacterium Tuberculosis. SRPlot was used in tandem with KEGG and GO to generate the visuals shown in figure 3.
RESULTS
Identification of Differentially Expressed Genes
GEO2R was initially used to identify the top 50 differentially expressed genes (DEGs) out of the primary 12381 genes identified from the samples. From the first two results, some genes were expressed differently between M. TB infected host cells and controls from all collected time periods (see figure 2). The volcano plot (Figure 2) is utilized to quickly identify the most meaningful changes in DEGs by combining a measure of statistical significance with the magnitude of change. The red dots represent genes which are upregulated, or more expressed; blue dots represent genes which are downregulated, or less expressed; and the black represents neither, or not significant. From the venn diagram (Figure 2), 1 DEG was common with all time periods; 3 were common with the earliest stage, 2 hours, and the latest stage, 72 hours; and 398 were common with the 24 hour stage and the 72 hour stage.
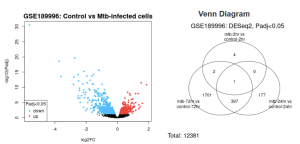
Figure 2: Differentially Expressed Genes: Volcano plot shows gene expression of patients infected with mtb versus the control after 72 hours while venn diagram shows the count of shared and separate DEGs between every recorded time period.
Identification of 50 Statistically Significant Differentially Expressed Genes (DEGs)
To identify the top 50 DEGs, the 12381 genes were organized by padj, p-value, and stat. Padj is the adjusted p-value statistic, making it more significant.10 Stat, or the Wald Statistic, measures the statistical significance of data.10 Out of the top 50 genes selected, 30 of the genes were chosen with the highest stat value and were upregulated and 20 of the genes with the lowest stat value, downregulated, but maintained a padj value < 7.00E-15.
Potential Functions and Enrichment of the Identified Genes and/or pathways
SR Plot was used to visualize and determine the function of genes. From the KEGG results, the TNF and MAPK signaling pathways were identified as statistically significant due to the high presence of top 50 DEGs. KEGG additionally identified TNF, FOS, FOSB, SIRT1, KLF4, KLF5, PMAIP1, HERPUD1, DUSP1, IRS2, ODC1, SLC16A1, DUSP2, JUNB, CXCL3, EIF2AK3, and GADD45B as significant genes of equal significance in discovered pathways. Out of these genes, we identified TNF, FOS, SIRT1, KLF4, KLF5, PAMIP1, HERPUD1, and EIF2AK3 as key genes.
The GO results identified the regulation of endoplasmic reticulum stress-induced intrinsic apoptosis signaling pathway and positive regulation of pre-miRNA transcription by RNA polymerase II as the most major biological process pathways. GO results were analyzed in tandem with genes identified from KEGG to find related potential functions and genes.
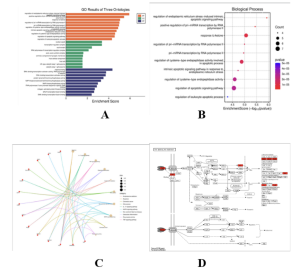
Fig. 3
Functional pathway and Kyoto Encyclopedia of Genes and Genomes (KEGG) enrichment analysis of top 50 differentially expressed genes (DEGs) for Mycobacterium Tuberculosis. GO Bar plot of Biological Processes (BP), Molecular Functions (MF), and Cellular Components (CC) of upregulated DEGs (A), Bubble plot of upregulated DEG-enriched biological processes (B), KEGG Cnet plot of upregulated DEGs (C), and KEGG Pathway of the TNF signaling pathway (D) via SRPlot.
DISCUSSION
Summary of Findings:
The goal of this research was to identify molecular signatures in the host which can be used to predict the progression from latent to active TB which can allow for identifying high-risk individuals. GEO2R Analysis, gene ontology, and KEGG found the biological processes of the regulation of endoplasmic reticulum stress-induced intrinsic apoptotic signaling pathway and positive regulation of pri-mRNA transcription by RNA polymerase II as the most enriched and statistically significant processes. Gene ontology (GO) identified apoptosis and positive regulation of mRNA transcription as the two most enriched biological processes, and the CNET plot provides associated genes:
Positive regulation is associated with FOS, KLF5, KLF4, and TNF.
ER stress-induced Apoptosis is associated with PMAIP1, EIF2AK3, HERPUD1, and SIRT1.
Positive regulation of miRNA transcription is defined as any process that activates or increases the frequency, rate or extent of microRNA (miRNA) gene transcription [16]. The apoptotic signaling pathway in response to ER stress is the series of molecular signals in which an intracellular signal is conveyed to trigger the apoptotic death of a cell. The pathway is induced in response to a stimulus indicating endoplasmic reticulum (ER) stress, and ends when the execution phase of apoptosis is triggered. ER stress usually results from the accumulation of unfolded or misfolded proteins in the ER lumen [17]. FOS, KLF5, and KLF4 are all transcription factors. However, KLF5 and KLF4 are Kruppel-like factors which are associated with colorectal cancer. KLF4 acts as a tumor suppressor and KLF5 acts as an oncogene [18]. These genes are also in the MAPK signaling pathway [19]. TNF plays a crucial role in inflammation, the TNF signaling pathway, and the MAPK signaling pathway [20,21]. PMAIP1 or Noxa helps induce cell death.22,23 PERK (EIF2AK3) and HERPUD1 are used for ER stress response, inhibiting translation and removing misfolded proteins respectively [24]. SIRT1 is involved in a lot of processes as it deacetylates, but importantly it helps cells adapt to oxidative pressures, like HERPUD1, and is shown to have anti-inflammatory properties [25-27].
Interpretation of Results:
In the RNA Polymerase II process, FOS and KLF5 seem to override [28,29] KLF4’s [30,31] tissue-protective signaling which causes immune polarization failure. FOS would continue unregulated and cause an influx of cytokine production. A high-risk signature would be a certain ratio of upregulated FOS and KLF5 to downregulated KLF4 (high KLF5:KLF4 ratio). In the ER stress-induced pathway, SIRT1 is likely deacetylating p5332, which induces PMAIP1, and suppressing apoptotic pathways, causing PERK hyperactivity. This leads to chronic stress memory in macrophages leading to a heightened inflammatory response upon subsequent stimulation, even without the original stressor [33]. Moreover, SIRT1 and PERK are likely making a pro-stress cellular environment [34] in latent TB, which prevents PMAIP1 driven apoptosis. In this case, latent TB patients with upregulated SIRT1 and PERK in monocytes can be tested for progression to validate this biomarker. Finally, TNF is possibly in a feedback loop where it induces FOS [35] to bind to the TNF promoter, which creates more TNF, overall fueling an apoptosis blockade via SIRT1. An important biomarker would be high TNF, FOS, and SIRT1 indicating a very high-risk individual.
Table 1: Summary of Results
Hypothesized process | Function | Involved genes/pathways | Biomarkers |
RNA Polymerase II Process |
|
| High KLF5 to KLF4 ratio. Upregulated KLF5 and FOS. |
ER Stress-induced Apoptosis Process |
|
| Upregulated SIRT1 and PERK. Downregulated PMAIP1. |
TNF Feedback Loop Process |
|
| Upregulated TNF, FOS, and SIRT1. Increased TNF promoters. Indicates an extremely high-risk of progression. |
Comparison with Previous Studies:
ER Stress-induced Apoptosis Process
M TB infection inhibits apoptosis by upregulating factors like Mcl-1 which are anti-apoptotic and suppresses PMAIP1-mediated cell death. This aligns with Simper et al. [36] findings that M. TB induces PPARγ expression, leading to macrophage survival and bacterial persistence. PERK ER stress responses are critical in TB pathogenesis as studies [32,37] confirm that chronic ER stress in macrophages creates a “stress memory” which allows for bacterial survival and granuloma necrosis. SIRT1 deacetylating pro-apoptotic proteins and blocking mitochondrial apoptosis is consistent with TB models [37,38] showing SIRT1 overexpression promoting bacterial reservoirs by inhibiting infected cell death.
RNA Polymerase II Process and TNF Feedback Loop Process
Herta et al. [31] support the link between KLF4 and KLF5 and the development of increased cytokines due to their opposing roles in inflammation and immune regulation. Wang et al. [39] support the increased attention in M. TB therapies to TNF receptors and FOS related genes suggesting and backing up their importance in the RNA Polymerase II process.
Implications:
By identifying similarities between the infection of TB to the progression of latent to active TB, the genes and pathways identified in this study can serve as pre-72 hour biomarkers to stratify patients by risk of progression and be utilized in clinical tests. By doing so, clinical resources can be more effectively allocated to patients as excessive testing and repetitive screening can be avoided entirely and look to decrease global cases of TB as less patients will be infected.
Limitations:
In our case, since we use bioinformatics datasets from RNA-seq experiments conducted by other researchers, one limitation is that the identified genes will need to be further studied in the laboratory or clinical environment before developing any interventions. Additionally, the chosen dataset was of a low sample size in Ohio and Texas and only validated by a single follow up study in South Africa, which although proves statistical significance it loses its effectiveness due to the extremely high variability of TB infections on hosts. Of course, the proposed mechanisms are hypothetical and have limited clinical validation and require further testing to validate. Finally, the chosen dataset was of non-infected cells derived from donors versus infected cells. Therefore, the proposed mechanisms in this study are only valid if similar mechanisms can be found from infection of TB and progression of TB.
Future Directions:
Studies can be conducted to identify similar mechanisms in infection of TB and progression of TB, which when compared to the results of this study can find proposed mechanisms which work most effectively. The mechanisms of the proposed processes and biomarkers can be further researched to confirm the logistics of them. Then, clinical trials can be conducted to identify if the proposed biomarkers are conducive of the progression of TB. Specifically, we would recommend to focus on SIRT1 activity and the KLF5:KLF4 ratio as upstream controllers of the proposed mechanisms. They are detectable, mechanistically grounded, and most clinically actionable.
References
- Glaziou P, Floyd K, Raviglione MC. Global Epidemiology of Tuberculosis. Seminars in Respiratory and Critical Care Medicine [Internet]. 2018 Jun 1;39(3):271–85. Available from: https://www.ncbi.nlm.nih.gov/pubmed/30071543
- de Martino M, Lodi L, Galli L, Chiappini E. Immune response to mycobacterium tuberculosis: A narrative review. Frontiers in Pediatrics [Internet]. 2019;7:350. Available from: https://pmc.ncbi.nlm.nih.gov/articles/PMC6718705/
- Pahal P, Sharma S. PPD Skin Test (Tuberculosis Skin Test) [Internet]. PubMed. Treasure Island (FL): StatPearls Publishing; 2020. Available from: https://www.ncbi.nlm.nih.gov/books/NBK556037/
- Sotgiu G, Saderi L, Petruccioli E, Aliberti S, Piana A, Petrone L, et al. QuantiFERON TB Gold Plus for the diagnosis of tuberculosis: a systematic review and meta-analysis. Journal of Infection [Internet]. 2019 Nov;79(5):444–53. Available from: https://www.sciencedirect.com/science/article/pii/S0163445319302580
- Zaman K. Tuberculosis: a global health problem. Journal of health, population, and nutrition [Internet]. 2010 Apr;28(2):111–3. Available from: https://pmc.ncbi.nlm.nih.gov/articles/PMC2980871/
- Gupta A, Kaul A, Tsolaki AG, Kishore U, Bhakta S. Mycobacterium tuberculosis: Immune evasion, latency and reactivation. Immunobiology [Internet]. 2012 Mar [cited 2019 Oct 24];217(3):363–74. Available from: https://www.sciencedirect.com/science/article/pii/S0171298511001392?via%3Dihub#bib0440
- Aderaye G, G/Egziabher H, Aseffa A, Worku A, Lindquist L. Comparison of acid-fast stain and culture for Mycobacterium tuberculosis in pre- and post-bronchoscopy sputum and bronchoalveolar lavage in HIV-infected patients with atypical chest X-ray in Ethiopia. Annals of Thoracic Medicine. 2007;2(4):154.
- Burel JG, Singhania A, Dubelko P, Muller J, Tanner R, Parizotto E, et al. Distinct blood transcriptomic signature of treatment in latent tuberculosis infected individuals at risk of developing active disease. Tuberculosis [Internet]. 2021 Sep 14;131:102127. Available from: https://www.sciencedirect.com/science/article/pii/S1472979221000779
- Vasiliu A, Martinez L, Gupta RK, Hamada Y, Ness T, Kay A, et al. Tuberculosis prevention: current strategies and future directions. Clinical Microbiology and Infection [Internet]. 2023 Oct 31;30(9). Available from: https://www.sciencedirect.com/science/article/abs/pii/S1198743X23005335
- Barrett T, Troup DB, Wilhite SE, Ledoux P, Rudnev D, Evangelista C, et al. NCBI GEO: archive for high-throughput functional genomic data. Nucleic Acids Research. 2009 Jan 1;37(Database):D885–90.
- Sadee W, Cheeseman IH, Papp A, Pietrzak M, Seweryn M, Zhou X, et al. Human alveolar macrophage response to Mycobacterium tuberculosis: immune characteristics underlying large inter-individual variability. Research Square [Internet]. 2023 Jun 8 [cited 2024 Jun 30];rs.3.rs2986649. Available from: https://www.ncbi.nlm.nih.gov/pmc/articles/PMC10275041/
- Kanehisa M, Goto S. KEGG: Kyoto Encyclopedia of Genes and Genomes. Nucleic Acids Research. 2000 Jan 1;28(1):27–30.
- Tang D, Chen M, Huang X, Zhang G, Lin Z, Zhang G, et al. SRplot: A free online platform for data visualization and graphing. PLOS ONE. 2023 Nov 9;18(11):e0294236–6.
- Aleksander S, Balhoff JP, Carbon S, J. Michael Cherry, Drabkin HJ, Ebert D, et al. The Gene Ontology Knowledgebase in 2023. Genetics. 2023 Mar 3;224(1).
- Ashburner M, Ball CA, Blake JA, Botstein D, Butler H, Cherry JM, et al. Gene Ontology: tool for the unification of biology. Nature Genetics. 2000 May;25(1):25–9.
- Van PM, Finnegan EF, Stark T, Angelus EP, Homan KE, Yeo GW, et al. The Period protein homolog LIN-42 negatively regulates microRNA biogenesis in C. elegans. Developmental Biology. 2014 Mar 31;390(2):126–35.
- Guérin R, Arseneault G, Dumont S, Rokeach LA. Calnexin Is Involved in Apoptosis Induced by Endoplasmic Reticulum Stress in the Fission Yeast. Brodsky JL, editor. Molecular Biology of the Cell. 2008 Oct;19(10):4404–20.
- GHALEB AM, NANDAN MO, CHANCHEVALAP S, DALTON WB, HISAMUDDIN IM, YANG VW. Krüppel-like factors 4 and 5: the yin and yang regulators of cellular proliferation. Cell Research. 2005 Feb;15(2):92–6.
- ZHANG W, LIU HT. MAPK Signal Pathways in the Regulation of Cell Proliferation in Mammalian Cells. Cell Research [Internet]. 2002 Mar;12(1):9–18. Available from: https://www.nature.com/articles/7290105
- Pennica D, Nedwin GE, Hayflick JS, Seeburg PH, Derynck R, Palladino MA, et al. Human tumour necrosis factor: precursor structure, expression and homology to lymphotoxin. Nature. 1984 Dec;312(5996):724–9.
Gibbings SL, Haist KC, Redente EF, Henson PM, Bratton DL. TNFα: TNFR1 signaling inhibits maturation and maintains the pro-inflammatory programming of monocyte-derived macrophages in murine chronic granulomatous disease. Frontiers in Immunology. 2024 Feb 9;15.
- Jansson AK, Emterling AM, Arbman G, Sun XF. Noxa in colorectal cancer: a study on DNA, mRNA and protein expression. Oncogene [Internet]. 2003 Jul 24 [cited 2025 Aug 4];22(30):4675–8. Available from: https://www.nature.com/articles/1206655
- Liu Y, Mondello P, Erazo T, Neeta Bala Tannan, Asgari Z, Elisa de Stanchina, et al. NOXA genetic amplification or pharmacologic induction primes lymphoma cells to BCL2 inhibitor-induced cell death. Proceedings of the National Academy of Sciences of the United States of America. 2018 Nov 7;115(47):12034–9.
- Gonen N, Sabath N, Burge CB, Shalgi R. Widespread PERK-dependent repression of ER targets in response to ER stress. Scientific Reports [Internet]. 2019 Mar 13 [cited 2025 Aug 4];9(1). Available from: https://www.nature.com/articles/s41598-019-38705-5
- Dipasree Hajra, Rajmani RS, Chaudhary AD, Gupta SK, Dipshikha Chakravortty. Salmonella-induced SIRT1 and SIRT3 are crucial for maintaining the metabolic switch in bacteria and host for successful pathogenesis. bioRxiv (Cold Spring Harbor Laboratory). 2022 Nov 21;
- Dipasree Hajra, Rajmani RS, Chaudhary AD, Gupta SK, Dipshikha Chakravortty. Salmonella-induced SIRT1 and SIRT3 are crucial for maintaining the metabolic switch in bacteria and host for successful pathogenesis. 2024 Feb 13 [cited 2025 Aug 4]; Available from: https://elifesciences.org/reviewed-preprints/93125v1
- Yang Y, Liu Y, Wang Y, Chao Y, Zhang J, Jia Y, et al. Regulation of SIRT1 and Its Roles in Inflammation. Frontiers in Immunology [Internet]. 2022 Mar 11;13. Available from: https://doi.org/10.3389%2Ffimmu.2022.831168
- Dalhäusser AK, Rössler OG, Thiel G. Regulation of c-Fos gene transcription by stimulus-responsive protein kinases. Gene. 2022 May;821:146284.
- Lara Aparicio SY, Laureani Fierro Á de J, Aranda Abreu GE, Toledo Cárdenas R, García Hernández LI, Coria Ávila GA, et al. Current Opinion on the Use of c-Fos in Neuroscience. NeuroSci [Internet]. 2022 Dec 1;3(4):687–702. Available from: https://www.mdpi.com/2673-4087/3/4/50#:~:text=Currently%2C%20c%2DFos%20immunohistochemistry%20is
- McConnell BB, Ghaleb AM, Nandan MO, Yang VW. The diverse functions of Krüppel-like factors 4 and 5 in epithelial biology and pathobiology. BioEssays. 2007;29(6):549–57.
- Herta T, Bhattacharyya A, Hippenstiel S, Zahlten J. The role of KLF4 in phagocyte activation during infectious diseases. Frontiers in Immunology. 2025 Apr 16;16.
- Kokkosis AG, Madeira MM, Hage Z, Valais K, Koliatsis D, Resutov E, et al. Chronic psychosocial stress triggers microglial-/macrophage-induced inflammatory responses leading to neuronal dysfunction and depressive-related behavior. Glia [Internet]. 2024 Jan;72(1):111–32. Available from: https://pubmed.ncbi.nlm.nih.gov/37675659/
- Yu J, Auwerx J. Protein deacetylation by SIRT1: An emerging key post-translational modification in metabolic regulation. Pharmacological Research. 2010 Jul;62(1):35–41.
- Ghosh HS, Reizis B, Robbins PD. SIRT1 associates with eIF2-alpha and regulates the cellular stress response. Scientific Reports [Internet]. 2011 Nov 9 [cited 2025 Aug 4];1(1). Available from: https://www.nature.com/articles/srep00150
- Haliday EM, Ramesha CS, Ringold G. TNF induces c-fos via a novel pathway requiring conversion of arachidonic acid to a lipoxygenase metabolite. EMBO journal. 1991 Jan 1;10(1):109–15.
- Simper JD, Perez E, Schlesinger LS, Azad AK. Resistance and Susceptibility Immune Factors at Play during Mycobacterium tuberculosis Infection of Macrophages. Pathogens. 2022 Oct 6;11(10):1153.
- Gu W, Huang Z, Fan Y, Li T, Yu X, Chen Z, et al. Peripheral blood microbiome signature and Mycobacterium tuberculosis-derived rsRNA as diagnostic biomarkers for tuberculosis in human. Journal of Translational Medicine. 2025 Feb 19;23(1).
- Hashemi M, Zali N, Zahra S, Bita Pakshad, Melika Aliahmadi, Sharifi N, et al. SIRT1 as a masterful reciprocal regulator of molecular mechanisms and signaling pathways involved in tumor growth and expansion. Clinical and Experimental Medicine [Internet]. 2025 Jul 1 [cited 2025 Aug 4];25(1). Available from: https://pmc.ncbi.nlm.nih.gov/articles/PMC12213863/
- Wang C, Zou RQ, He GZ. Progress in mechanism-based diagnosis and treatment of tuberculosis comorbid with tumor. Frontiers in Immunology. 2024 Jan 17;15.
- Houben RMGJ, Dodd PJ. The Global Burden of Latent Tuberculosis Infection: A Re-estimation Using Mathematical Modelling. Metcalfe JZ, editor. PLOS Medicine [Internet]. 2016 Oct 25;13(10):e1002152. Available from: https://journals.plos.org/plosmedicine/article?id=10.1371/journal.pmed.1002152
- Simcox BS, Tomlinson BR, Shaw LN, Rohde KH. Mycobacterium abscessus DosRS two-component system controls a species-specific regulon required for adaptation to hypoxia. Frontiers in Cellular and Infection Microbiology. 2023 Mar 9;13.

