Exploring the Genetics of Glaucoma through Bioinformatics Research

Exploring the Genetics of Glaucoma through Bioinformatics Research - Rohan Gazula
ABSTRACT
Background
Glaucoma is the leading cause of irreversible blindness worldwide, affecting roughly 80 million people. Anyone can be at risk of glaucoma, although it is more common among African-American and Latino populations. Glaucoma is characterized as the deterioration of the optic nerve, which commonly occurs as a result of excessive intraocular eye pressure (IOP). Glaucoma can result in loss of vision and in some cases blindness. The problems in this disease lie in the fact that it is not very well understood, despite its prevalence. There are multiple complex molecular mechanisms at play in the behavior of this disease. The exact mechanisms that lead to the deterioration of the optic nerve are not fully understood, and while elevated IOP is certainly a factor, there could exist several other influences such as blood flow and autoimmune responses.
Therefore, the goal of this research study is to uncover potential genes or genetic components that are associated with the behavior of glaucoma, ultimately to provide genetic information and biomarkers that can potentially assist in the understanding of this disease.
Methods
This study used several bioinformatics tools—namely, Gene Expression Omnibus (GEO), GEO2R, and SR Plot. The GEO dataset used to collect data was GSE218153, a study that specifically analyzed human trabecular meshwork cells cultured in a lab. As a control, the researchers used a gene called normal TIPARP in the control group and increased TIPARP in the experimental group using a special virus, lentivirus-GFP-TIPARP. In our study, we used GEO2R to categorize and analyze the groups into a control group with elevated eye pressure and a group with upregulated TIPARP with lowered eye pressure. Genes expressed differently (DEGs) between these two groups were identified using GEO2R. Then SR Plot was used to conduct enrichment analysis of the top 30 DEGs and was used for GO and KEGG pathway analysis.
Results
5248 genes were initially identified across the control and experimental groups (Figure 2B), but after considering fold change and p value, 30 top DEGs were identified (Supplementary Results 2). Enriched gene ontology terms include “Response to lipopolysaccharide,” “Response to molecules of bacterial origin,” “cellular response to lipopolysaccharide,” and “cellular response to molecules of bacterial origin”. Enriched KEGG Pathways include “IL-17 signaling pathway,” Viral protein interaction with cytokine and cytokine receptor,” cytokine-cytokine receptor interaction,” and “Influenza A”. “Response to lipopolysaccharide,” “cellular response to lipopolysaccharide,” “Viral protein interaction with cytokine and cytokine receptor,” and “cytokine-cytokine receptor interaction” summarize the findings related to the DEGs along with the top common genes CXCL11, CXCL10, RSAD2, and CSF2.
Conclusion
The gene function “response to lipopolysaccharide” and biological pathway “Viral protein interaction with cytokine and cytokine receptor,” along with 4 top common genes: CXCL11, CXCL10, RSAD2, CSF2 are all in some way related to inflammation, which reveals an important insight into glaucoma. Glaucoma-related inflammation is now a potential field of further study as it relates to many of the common genes, functions, and biological pathways. Future study in this direction could accelerate the development of a cure for glaucoma.
INTRODUCTION
As the learning cause of irreversible blindness, glaucoma affects roughly 80 million people worldwide (1, 2). In spite of its prevalence, this disease is problematic in that it is not very well understood; there are multiple complex molecular mechanisms involved in its pathology (2). This research study attempts to address this important issue by revealing findings surrounding the genetic mechanisms of glaucoma. Specifically, this research study attempts to answer the question, “what genes or genetic components are associated with the behavior of glaucoma?”; in other words, “what genetic information and biomarkers can assist in the understanding of this disease?” GEO (http://www.ncbi.nlm.nih.gov/geo) provides publicly available datasets, containing the gene expression of several diseases (3). Using a GEO Dataset containing glaucoma, along with several bioinformatics tools, this study will provide sufficient insights into the precise genes associated with glaucoma.
Glaucoma comprises a family of conditions that are marked by damage to the optic nerve as a result of several risk factors, commonly as a result of high pressure in the eyes (1). However, as the molecular pathways that lead to this deterioration of the optic nerve are rather unclear, the experimental findings of this study are essential to providing a better understanding of this complex disease (2). It is known that if left untreated, in some cases glaucoma can lead to irreversible blindness due to excessive deterioration of the optic nerve (1). It is also known that there are several types of glaucoma, including primary open-angle glaucoma, angle-closure glaucoma, normal-tension glaucoma, secondary glaucoma, or congenital glaucoma (1).
In regards to bioinformatics study, it is also known that risk factors of glaucoma include elevated eye pressure, older age ( >40), race/ethnicity, other medical conditions (diabetes, hypertension, CVD), and eye injuries (2). Thus, genetics associated with these trends are pathways to explore in the understanding of this disease. It is further known that an effective treatment plan and an early detection of glaucoma can help mitigate vision loss, which suggests the importance of bioinformatics efforts in the study of this disease (1). However, the exact mechanisms that lead to the deterioration of the optic nerve are not fully understood (2). Although elevated eye pressure is a factor which contributes to damage to the optic nerve (1) there could be several other risk factors including blood flow and autoimmune responses that may also play a role in damaging the optic nerve.
The goal of this research regarding gene expression is to uncover notable upregulated or downregulated genes associated with the glaucoma pathology, that is, the typical behavior of the condition of glaucoma. Given the association between elevated Intraocular pressure (IOP) and glaucoma, the hypothesis is that, there certainly will exist differences in the expression of genes between controls and patients, with some genes being upregulated and downregulated in glaucoma patients, especially those related to IOP. In order to accomplish this goal, the bioinformatics tools of Gene Expression Omnibus (GEO), GEO2R, and SR Plot were used. GEO (http://www.ncbi.nlm.nih.gov/geo) is a publicly available database within the National Center for Biotechnology Information (3). Specifically, GEO provides publicly available datasets, containing the gene expression of several diseases (3). GEO2R (http://www.ncbi.nlm.nih.gov/geo/geo2r/) is a program designed to compare gene expression between different groups, yielding fold-change and P-values (4). SR Plot is a program which assists finding gene functions and biological mechanisms (5). SR Plot also assists in visualizing this data and exploring this data through different graphs (5).
The importance of this research lies in the fact that as a disease, glaucoma is highly prevalent among the population, serving as the leading cause of irreversible blindness world-wide (1). Furthermore, as it concerns disease whose genetic mechanisms are relatively less-understood, my research is thus critical to finding a treatment for this both prevalent and enigmatic disease. A better understanding of the genetic mechanisms behind glaucoma can ultimately make a large impact, as it could reveal underlying biological mechanisms and facilitate the development of new treatments.
METHODS
To conduct this bioinformatics study, different methods were used and are summarized in the flowchart below (Figure 1). This study utilized several bioinformatics tools, including the Gene Expression Omnibus (GEO), GEO2R, and SR Plot.
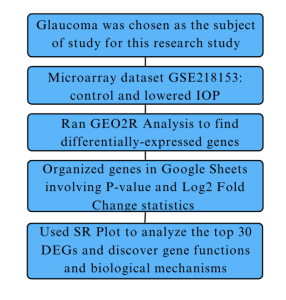
Figure 1: Flowchart of steps taken to conduct this bioinformatics study. Summary of the various steps and bioinformatics tools used in this tidy including the Gene Expression Omnibus (GEO), GEO2R, and SR Plot.
Determining the Dataset for Data Collection
The study dataset used for data collection was identified by consulting GEO, a publicly available database containing several pathologies’ gene expression, to obtain the glaucoma dataset (3). After searching through the GEO database, the dataset of study “TIPARP is involved in the regulation of intraocular pressure” was selected as an adequate pool of data to analyze, with the accession number GSE218153. This study, which explores the effect of the TIPARP gene, was conducted by analyzing human trabecular meshwork cells cultured in a lab, with normal TIPARP in the control group and increased TIPARP in the experimental group using a special virus, lentivirus-GFP-TIPARP (6). The study then explored the difference between the control group and the upregulated TIPARP group, implementing gene expression analysis using RNA sequencing (6).
Identifying the most Differentially-Expressed Genes using GEO2R Bioinformatics Tool
Differentially expressed genes are genes that are prevalent to different extents among distinct groups (7).
To identify the most Differentially-Expressed Genes among individuals with elevated and normal eye pressure, the dataset GSE218153 was analyzed using GEO2R, an online bioinformatics tool for the purpose of evaluating different sample groups (4). Before analyzing the groups through this method, the data was first deliberately sorted into two groups, a control group and TIPARP-upregulated group. Then, data was analyzed using the GEO2R user interface, an AI and ML pre-programmed interface that uses the R programming language. This GEO2R analysis generated several results of differentially expressed genes (DEGs).
The DEGs or differentially expressed genes were then statistically narrowed down to the top 30 DEGs using the P-value and log2FC. All genes with a P-value greater than 0.05 were eliminated, leaving genes with sufficient authenticity. Finally, the top 30 DEGs were determined by sorting the log2FC to those with the highest magnitudes specifically, the 15 most positive and the 15 most negative. These 30 genes were either the most comparatively upregulated in the control or the experimental group. After identifying the 30 most expressed DEGs on both ends of the spectrum, namely, comparative upregulation in the control vs comparative upregulation in the experimental groups these genes were isolated on a separate Google Sheet, along with their corresponding log2FC values.
Determining Functions and Biological Pathways of top DEGs using SR Plot
Next, the SR Plot bioinformatics tool was used to determine the functions of these specific genes and the biological pathways that they contribute to (5). After navigating to bioinformatics.com.cn/en, the term “enrichment,” was searched. Finally, after clicking on “GO Pathway Enrichment Analysis,” the list of 30 genes and their FC values, was copied and pasted into the bioinformatics tool. This data was then downloaded, which included the functions of the 30 DEGs in the Gene Ontology and the biological pathways of the 30 DEGs in the KEGG enrichment analysis.
RESULTS
Differentially Expressed Genes and GEO2R Analysis
GEO2R analysis of the dataset GSE218153 initially resulted in 5,248 genes across the control and experimental groups (Figure 2B). However, after considering the statistics of fold change and p-value, the list was refined to the top 30 differentially expressed genes (DEGs) (Top DEGs).
The red dots in the volcano plot diagram indicate genes that are upregulated in the higher IOP, control group. On the contrary, the blue dots in the volcano plot indicate the genes that are downregulated in the higher IOP, control group. Finally, the black dots indicate genes that are not statistically significant enough—in other words, the genes with too high of a p-value. The venn diagram shows that out of a total of 16277 genes, 5248 genes were differentially expressed across the control and experimental group. These GEO2R results were generated using R programming which is already abstracted and pre-programmed using AI and ML algorithms (R Script Used to Generate GEO2R Results).
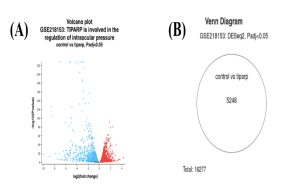
Figure 2. Differentially expressed genes from GEO2R analysis. Volcano Plot (A) shows DEGs across control and TIPARP upregulated groups. Venn Diagram (B) shows the DEGs in the control versus the TIPARP upregulated groups.
30 Top DEGs total were identified; 15 upregulated and 15 downregulated in control
GO Enrichment Analysis with SR Plot
Gene ontology analysis using SR Plot revealed several enriched terms, including “Response to lipopolysaccharide,” “Response to molecule of bacterial origin,” “Cellular response to lipopolysaccharide,” and “Cellular response to molecule of bacterial origin.” These terms suggest a significant involvement of these genes in immune response mechanisms.
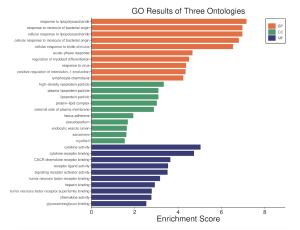
Figure 3. GO Results of three ontologies. The orange bars designate biological processes, the green bars designate cellular components, and the purple bars designate molecular functions.
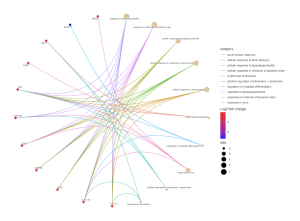
Figure 4. GO Enrichment Analysis – Biological Processes Cnet Plot. The circles on the outside of the web represent genes, and the more enriched genes are CXCL10, CXCL11, CSF2, CMPK2, LCN2, LGALS9, TNF, SAA2, SAA1, and RSAD2. These genes link to the biological processes response to lipopolysaccharide, response to molecule of bacterial origin, cellular response to lipopolysaccharide, cellular response to biotic stimulus, acute-phase response, regulation of myoblast differentiation, response to virus, positive resolution of interleukin-1 productions, and lymphocyte chemotaxis. Genes with a higher Log2 fold change are more red while genes with a lower Log 2 fold change are more blue.
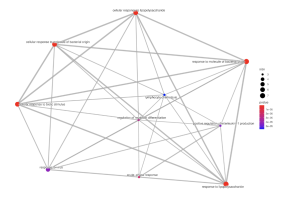
Figure 5. GO Enrichment Analysis – Biological Processes Emap Plot. The circles connecting the lines represent biological processes, and the circles with a lower p-value are redder and more significant. The more significant processes are response to lipopolysaccharide, response to molecule of bacterial origin, cellular response to lipopolysaccharide, cellular response to biotic stimulus, and acute-phase response. The circles with a higher p-value are more blue and less significant.
KEGG Pathway Enrichment Analysis with SR Plot
In addition to gene ontology, pathway enrichment analysis using the KEGG database identified several relevant pathways. These include the “IL-17 signaling pathway,” “Viral protein interaction with cytokine and cytokine receptor,” “Cytokine-cytokine receptor interaction,” and “Influenza A” pathways. These pathways highlight the potential roles of the DEGs in inflammatory responses and interactions with viral proteins.
Enriched Pathways: IL-17 signaling pathway, Viral protein interaction with cytokine and cytokine receptor, cytokine-cytokine receptor interaction, Influenza A
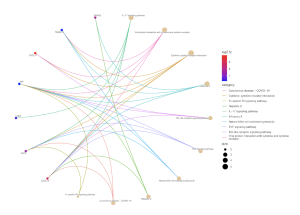
Figure 6. Kegg Pathway Analysis – Cnet Plot. The circles on the outside of the web represent genes, and genes with a higher Log2 fold change are redder and more significant. The most significant genes are CXCL10 and CXCL11 which are associated with the pathways of viral protein interaction with cytokine and cytokine receptor, cytokine-cytokine receptor interaction, toll-like receptor signaling pathway, coronavirus disease – COVID-19, Hepatitis C, TNF signaling pathway, Influenza A, and IL-17 signaling pathway. Genes with a lower Log 2 fold change are more blue and less significant.
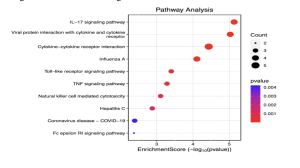
Figure 7. Kegg Pathway Analysis – Enrichment Score Dotplot. The circles on the graph represent biological pathways, and the circles with a lower p-value are more red and further to the right (more significant) while those with a higher p-value are more blue and further to the left.
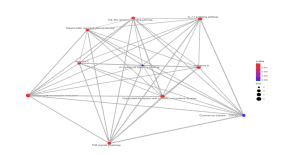
Figure 8. Kegg Pathway Analysis – Emap Plot. The circles connecting the lines represent biological pathways, and the circles with a lower p-value are redder and more significant. The most significant pathways are cytokine-cytokine receptor interaction, IL-17 signaling pathway, toll-like receptor signaling pathway, natural killer cell mediated cytotoxicity, Hepatitis C, Influenza A, Viral protein interaction with cytokine and cytokine receptor, and TNF signaling pathway. The circles with a higher p-value are more blue and less significant.
Key findings related to the top genes, functions and biological pathways that are potentially linked to Glaucoma disease are summarized in Table 1. The key gene functions were related “Response to lipopolysaccharide,” “Cellular response to lipopolysaccharide,” “Viral protein interaction with cytokine and cytokine receptor,” and “Cytokine-cytokine receptor interaction.” Among the top common genes identified were CXCL11, CXCL10, RSAD2, and CSF2, which are known to play critical roles in immune response and inflammation. These results provide a deeper understanding of the molecular mechanisms at play and identify potential targets for further research and therapeutic intervention.
Table 1. Summary Table. Table shows the most significant gene functions and biological pathways, along with most significant common top genes.
Gene Functions | Biological Pathways | Common Top Genes |
Response to lipopolysaccharide | IL-17 signaling pathway | CXCL11 |
Response to molecule of bacterial origin | Viral protein interaction with cytokine and cytokine receptor | CXCL10 |
cellular response to lipopolysaccharide | cytokine-cytokine receptor interaction | RSAD2 |
cellular response to molecule of bacterial origin | Influenza A | CSF2 |
Supplementary Materials
Supplementary Materials 1. R Script used to generate DEG results using GEO2R Bioinformatics tool:R Script Used to Generate GEO2R Results
Supplementary Materials 2. Statistically significant top 30 DEGs:
DISCUSSION
These results provide insight into the overall goal of this research study which asked, “which genes or genetic components are associated with the behavior of glaucoma and how can they assist in the understanding of this disease?” The gene enrichment analysis revealed enriched gene functions, biological processes, and top common genes that could play significant roles in the behavior of the glaucoma disease.
The results in Figure 2 reveal both the most significant and most differentially expressed genes in a volcano plot. Figures 3-5 reveal many of the gene functions of the top 30 most differentially expressed genes, and these findings are relevant to the overall research question, as they could serve as potential biomarkers to assist in the understanding and treatment development of glaucoma. Among the gene functions, the biological processes (BP) category was the most enriched, suggesting its importance to the study. Additionally, figures 6-8 suggest several biological pathways surrounding the top 30 most differentially expressed genes, these findings again contributing to the research question by providing potential biomarkers of glaucoma and thus avenues to study. Figure 9 finally displays the most statistically significant gene functions, biological pathways, and top common genes. The top common genes were CXCL11, CXCL10, RSAD2, and CSF2.
One of the most significant gene functions was the “response to lipopolysaccharide”. According to existing scientific literature in this field, lipopolysaccharide (LPS) can potentially result in an acute inflammatory response, releasing a large quantity of inflammatory cytokines in many different types of cells (8). This inflammatory response may relate to inflammation in the eye, which could damage the trabecular meshwork and result in increased IOP, affecting glaucoma (6). The gene functions of “response to molecule of bacterial origin” and “viral protein interaction with cytokine and cytokine receptor” also may contribute to inflammation in the eye in a similar fashion, according to existing scientific literature (6). Furthermore, among the most significant common genes—CXCL11, CXCL10, RSAD2, and CSF2—while there has yet to be extensive study concerning these genes’ relation to glaucoma, all of these are related to inflammatory or neuroinflammatory processes (9, 10, 11, 12). CXCL11 is upregulated in cancer-associated fibroblasts, which result from inflammation (9). CXCL10 has been associated with myeloproliferative neoplasms in mouse models, which is excessive growth of blood cells (10). RSAD2 is upregulated among systemic lupus erythematosus (SLE) patients, which involves inflammatory processes (11). CSF2 is associated with the immune inflammation that is associated with Moyamoya Disease (12).
As shown in the results, many of the upregulated genes among those with higher IOP are associated with inflammation and inflammatory processes. The notion of inflammation in the human body as it relates to glaucoma is significant in the real world as it offers a genuine field for further study. A better understanding of the glaucoma-related inflammation could expedite the development of a glaucoma medicine or vaccine. More specifically, the genes CXCL11, CXCL10, RSAD2, and CSF2 can serve as potential biomarkers for glaucoma, not only serving as avenues of future study but also helping to detect glaucoma earlier in patients, which increases the chance of successful treatment (1, 12).
One limitation in this study is the limited sample size, as this research study only considered a single GEO bioinformatics dataset from microarray experiments. This limited pool of data could influence the findings of this research study, so the genes identified in this study may need to be studied further before finalizing the results. The identified genes, gene functions, and biological pathways will thus certainly need to be further studied in either the laboratory or clinical environment in the future, before the development of treatment for glaucoma.
Based on the findings of this study, several genes, gene functions, and biological processes can be associated with the behavior of glaucoma, and understanding this information as it relates to genomics can certainly be studied further to improve treatment steps for patients of a disease such as glaucoma (13). Specifically, the genes CXCL11, CXCL10, RSAD2, and CSF2 and their relation to inflammatory processes surrounding glaucoma are avenues for future study. If tested in the laboratory by scientists or through clinical trials, these biomarkers could provide insights into the intricate behavior of glaucoma. However, one possible opportunity for future study would be further analyzing the neurological aspects of glaucoma, in addition to the inflammation-related aspects. Especially considering the role of the optic nerve in glaucoma and its proximity to the brain (14), the connection between glaucoma and neurological diseases is another field to be studied. Understanding if other processes are at work alongside glaucoma, such as a correlation with Alzheimer’s and Parkinson’s, serves as a potential area of bioinformatics study and could advance the development of more effective treatment plans for glaucoma.
Conclusion
In conclusion, 5248 total DEGs were identified across two groups. After narrowing these DEGs down to 30, the most significant gene functions notably included “response to lipopolysaccharide” which is related to the significant biological pathway “Viral protein interaction with cytokine and cytokine receptor” (8). Additionally, 4 top common genes were identified and upregulated among patients with higher IOP: CXCL11, CXCL10, RSAD2, CSF2. All of these genes are in some way related to inflammation, which supports the hypothesis of potential upregulated genes. Furthermore, these findings answer the research goal of improving understanding of this disease, by suggesting a possible opportunity for further research on glaucoma-related inflammation.
References
- Aung, T., & Khor, C. C. (2016). Glaucoma genetics: Recent advances and future directions. The Asia-Pacific Journal of Ophthalmology, 5(4), 256-259. https://journals.lww.com/apjoo/fulltext/2016/07000/Glaucoma_Genetics__Recent_Advances_and_Future.7.aspx
- Barrett, T., Wilhite, S. E., Ledoux, P., Evangelista, C., Kim, I. F., Tomashevsky, M., Fonzar, J., LePage, D., & Soboleva, A. (2011). NCBI GEO: Archive for functional genomics data sets–10 years on. Nucleic Acids Research, 39(Database issue), D1005-D1010. https://doi.org/10.1093/nar/gkq1184
- Barrett, T., Wilhite, S. E., Ledoux, P., Evangelista, C., Kim, I. F., Tomashevsky, M., Fonzar, J., LePage, D., & Soboleva, A. (2013). NCBI GEO: Archive for functional genomics data sets–update. Nucleic Acids Research, 41(Database issue), D991-D995. https://doi.org/10.1093/nar/gks1193
- Belmonte, M., Foster, A., & Jones, H. (2024). Increased CXCL10 (IP-10) is associated with advanced myeloproliferative neoplasms and its loss dampens erythrocytosis in mouse models. Experimental Hematology, 135, 104246. https://doi.org/10.1016/j.exphem.2024.104246
- Gamm, D. M., & Albert, D. M. (2024). Optic nerve. Encyclopedia Britannica. https://www.britannica.com/science/optic-nerve
- Gene Ontology Consortium. (2024). GO enrichment analysis. Gene Ontology Resource. https://geneontology.org/docs/go-enrichment-analysis/
- KEGG: Kyoto Encyclopedia of Genes and Genomes. (2024). Kyoto University Bioinformatics Center. https://www.genome.jp/kegg/kegg1a.html
- Li, H., Li, X., & Yang, Z. (2024). GM-CSF promotes the development of dysfunctional vascular networks in Moyamoya disease. Neuroscience Bulletin, 40(4), 451-465. https://doi.org/10.1007/s12264-023-01158-y
- Liu, G., Wang, Z., & Xu, L. (2022). The LINC00152/miR-205-5p/CXCL11 axis in hepatocellular carcinoma cancer-associated fibroblasts affects cancer cell phenotypes and tumor growth. Cellular Oncology, 45(6), 1435-1449. https://doi.org/10.1007/s13402-022-00730-4
- National Center for Biotechnology Information. (2024). Programs. NCBI. https://www.ncbi.nlm.nih.gov/home/about/programs/
- “Genomics in Health Care.” (2023). National Geographic.
- Rao, K. N., Nagireddy, S., & Chakrabarti, S. (2011). Complex genetic mechanisms in glaucoma: An overview. Indian Journal of Ophthalmology, 59(Suppl1), S31-S42. https://doi.org/10.4103/0301-4738.73685
- Selvan, H., Patel, H., & Williams, K. (2022). Juvenile-onset open-angle glaucoma – A clinical and genetic update. Survey of Ophthalmology, 67(4), 1099-1117. https://doi.org/10.1016/j.survophthal.2021.09.001
- Tang, D., Xie, Z., & Zhou, X. (2023). SRplot: A free online platform for data visualization and graphing. PLOS One, 18(11), e0294236. https://doi.org/10.1371/journal.pone.0294236
- Tucureanu, M. M., Enciu, A. M., & Popescu, B. O. (2017). Lipopolysaccharide-induced inflammation in monocytes/macrophages is blocked by liposomal delivery of Gi-protein inhibitors. International Journal of Nanomedicine, 13, 63-76. https://doi.org/10.2147/IJN.S150918
- Wiggs, J. L. (2007). Genetic etiologies of glaucoma. Archives of Ophthalmology, 125(1), 30-37. https://doi.org/10.1001/archopht.125.1.30
- Wiggs, J. L., & Pasquale, L. R. (2017). Genetics of glaucoma. Human Molecular Genetics, 26(R1), R21-R27. https://doi.org/10.1093/hmg/ddx183
- Xin, Y., Lu, X., & Huang, J. (2023). Interferon-α regulates abnormally increased expression of RSAD2 in Th17 and Tfh cells in systemic lupus erythematosus patients. European Journal of Immunology, 53(8), e2350420. https://doi.org/10.1002/eji.202350420
- Zhang, Y., Song, M., & Lei, Y. (2022). TIPARP is involved in the regulation of intraocular pressure. Communications Biology, 5(1), 1386. https://doi.org/10.1038/s42003-022-03882-1
- “How to Employ Statistical Approaches to Identify Differentially Expressed Genes (DEG).” (2023). Novogene. https://www.novogene.com/us-en/resources/blog/how-to-employ-statistical-approaches-to-identify-differentially-expressed-genes-deg/

