Decoding the Genetic Blueprint: Polygenic Risk Scores for Cancer in Diverse Genome Data
ABSTRACT
Background
Colorectal cancer (CRC), the second leading cause of cancer-related death, has an increasing rate of early-onset cases. Understanding genetic risk factors of CRC through polygenic risk scores (PRS) can improve screening methods and reduce this rate, especially with the lack of accurate risk prediction tools for non-European populations.
Methods
This study seeks to investigate how the distribution of CRC PRS differs across ancestral groups and gender in diverse genome datasets. To accomplish this, large genome-wide datasets across ancestral groups (European, African, East Asian, South Asian, and Latino) are analyzed by matching genetic variants associated with CRC risk with those in the genomic sample dataset.
Results
PRS represents the cumulative effect of genetic variants on an individual’s susceptibility to CRC. A one-way ANOVA revealed that there was a statistically significant difference in PRS between at least two ancestral groups (F(4, 2499)= 25.91, p≈ 0). Tukey’s HSD test found the mean East Asian PRS was statistically significantly different compared to other groups (p-values<0.05). The PRS distribution differences across gender were insignificant in all ancestral groups (p-values>0.05).
Conclusion
This study improves genetic CRC risk knowledge and emphasizes the need of diverse genetic data into risk prediction.
INTRODUCTION
By analyzing the distribution of Polygenic Risk Scores (PRS) of diverse genomic data from the 1000 Genomes Project across various ancestral groups, this seeks to explore genetic differences across ancestry and gender that influence genetic susceptibility and risk of colorectal cancer (CRC) in order to improve risk prediction models. The increasing incidence of early-onset CRC highlights the weaknesses of current screening guidelines, stressing the use of improved risk prediction models that utilize diverse genetic data.
Background and Current Methods of Detection
As the second leading cause of cancer death in the United States, colorectal cancer and specifically the rate of early-onset CRC, or colorectal cancer diagnosed before the age of 50, has been increasing for the past 20 years [1]. Research has shown that from 1990 to 2016, the median age of CRC diagnosis has decreased from 72 to 66 [1]. Now, 1 in 10 of all new CRC diagnoses are classified as early-onset [2]. This is detrimental to people with colorectal cancer because their survival rates dramatically increase when the cancer is detected and diagnosed earlier, as “stage I disease has a five-year survival rate as high as 90%, but stage IV disease has a survival rate of less than 10%” [3]. The current CRC screening guidelines recommend starting at age 45. For individuals with a higher risk due to family history, screening may start at age 40. Nevertheless, this system is inadequate for detecting all cases of early-onset CRC before the cancer progresses to an advanced stage.
Polygenic Risk Scores
To increase the survival rates, a solution lies in creating risk prediction models trained on large genome-wide genetic data and analyzing the Polygenic Risk Score (PRS) of colorectal cancer. A PRS is a calculated value that represents an individual’s genetic susceptibility or risk to a specific trait or disease based on many genetic factors. PRS gives a method of quantifying an individual’s genetic risk based on the cumulative effects of multiple genetic variants.
However, the majority of genetic research had been distributed unfairly. “Currently, most genome-wide association studies only incorporate genetic data from people with European ancestry” [4]. Addressing this lack of research would make colorectal cancer screening more reliable across ancestries.
Previous Research
Currently, there are several investigations being conducted all around the world on specific ethnicities, such as East Asian and African populations. For example, researchers at Fred Hutch Cancer Center have developed models that incorporate Asian and European genome wide-association studies of CRC to improve the risk prediction across racial and ethnic populations [5]. These models attempt to gap the disparities in genetic research by including diverse genetic data, which is key for accurate risk prediction and equitable screening practices. By using large-scale GWAS data and incorporating genetic variants from multiple populations, these models improve the understanding of CRC risk factors and contribute to the development of population-specific risk prediction tools. For example, researchers from the Division of Cancer Epidemiology and Genetics at the National Cancer Institute have said, “Results from simulation studies show that multiancestry methods generally lead to the most accurate PRSs in different settings” [6].
Various studies have demonstrated that advanced PRS models can identify a broader group of high-risk individuals, which couldn’t have been identified with current screening methods. “Based on the LDpred-derived PRS, we are able to identify 30% of individuals without a family history as having risk for CRC similar to those with a family history of CRC, whereas the PRS based on known GWAS variants identified only top 10% as having a similar relative risk. About 90% of these individuals have no family history and would have been considered average risk under current screening guidelines, but might benefit from earlier screening” [7]. This significant improvement in percentage of identified individuals shows the potential positive impacts of more comprehensive genetic risk assessments.
Investigative Goals
What these investigations have not addressed is how the PRS calculation can show how the distribution of genetic risk varies across diverse ancestral groups and across genders within these populations. Understanding these variations can inform population-specific risk prediction tools and contribute to reducing health disparities in CRC outcomes. The goal of this research project is to calculate CRC PRS using diverse genome data and identify patterns in how the distribution of PRS varies across ancestral groups and across genders. This study will provide further insight into how genetic risk is distributed across ancestral groups and genders. The hypothesis of this study stated that if Polygenic Risk Scores (PRS) are calculated for colorectal cancer risk across different ancestral groups, the resulting scores will exhibit significant variation between the ancestral groups (European, African, East Asian, South Asian, American) represented in the diverse genome data, reflecting the genetic diversity and allele frequency differences among populations.
METHODS

Figure 1. An overview of the research project procedure: First, colorectal cancer genomic data from 1000 Genomes will be compiled together and preprocessed. With this data, the PRS is calculated, and the distributions of the PRS will be analyzed for patterns.
Genomic Data Preprocessing
First, genomic data from the 1000 Genomes Project was obtained by downloading the Variant Call Format (VCF) files for each chromosome from the official repository. Preprocessing with the VCF files had to be done because the rsID column of the VCF files were empty, which is required for matching SNP variants to calculate PRS. Using BCFtools and the provided “all variations” file from the 1000 Genomes Project, the SNP rsIDs were annotated into the VCF file. BCFtools is a set of command line tools that assist with large-scale genomic analyses and has features of indexing and annotating VCF files. Indexing the VCF files is necessary to ensure the files contain all of the appropriate resources to allow fast access to specific regions and position in the file. This assists the polygenic risk score calculating tool access the data inside the VCF file more efficiently and calculate scores even faster. The BCFtools annotation command goes into the VCF file and writes in the important information of SNP variant rsIDs. BCFtools provides the final indexed and annotated VCF files which are used to calculate PRS.
Polygenic Risk Score Calculations
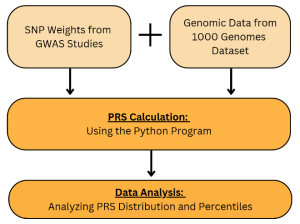
Figure 2. A flowchart of the PRS Analysis Process: The process starts by using the SNP Weights from previous GWAS Studies and Genomic Data from 1000 Genomes Dataset to calculate the PRS with the python program. With the final calculated PRS calculations, the PRS Distribution and Percentiles are analyzed with boxplots and distribution graphs.
To calculate the PRS, inputs from genomic data and CRC PRS weights are required. The genomic data was obtained by downloading the VCF files from the 1000 Genomes Project. This dataset was diverse, with 2504 individual samples with a demographic of 25% European, 25% African, 12.5% South Asian, 12.5% East Asian, and 25% Hispanic or Latin American ancestry. Additionally, the CRC PRS Weights file, which consisted of a table of Single-Nucleotide Polymorphisms (SNPs) with their effect sizes and reference alleles from previous Genome-Wide Association Studies (GWAS), were acquired from the publicly available Polygenic Score (PGS) Catalog. GWAS are observational studies that have identified associations between genetic variants, like SNPs, and traits such as CRC. The Polygenic Risk Scores were calculated using a publicly sourced python program, which used the Weights file and VCF file as inputs. rsIDs from the Weights file are matched and processed with rsIDs in VCF files, then summed in the PRS calculation. The python program used the following equation.
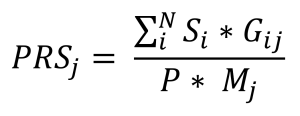
Figure 3. PRS Calculation Formula in PLINK: In this formula, the effect size of the SNP i is Si; the number of effect alleles observed in sample j is Gij; the ploidy of the sample is P (is generally 2 for humans); the total number of SNPs included in the PRS is N; and the number of non-missing SNPs observed in sample j is Mj.
In order to run these calculations faster and more efficiently, the individual samples were split into smaller sections. This was done so that scores of one hundred samples would be calculated in one run of the program. These smaller sections then allowed the computer to run the program up to six times at once, accelerating the calculation process. PRS is calculated for each of the twenty-two chromosomes which were analyzed during this study separately, so each individual chromosome PRS was added together to generate a PRS Sum Score.
RESULTS
To analyze the PRS distribution and percentiles across different ancestral groups, the mean, median, variance, standard deviation, and percentiles (25th, 50th, and 75th) were calculated using the PRS calculation results separated according to ancestral classification outlined in the integrated call samples file from the 1000 Genomes Project’s official repository.
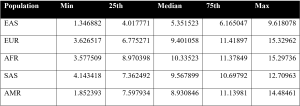
Figure 4. Table of PRS Distribution across various population groups.
From these values, a distribution line graph of PRS across population groups was created. PRS across gender within each ancestral group was plotted in separate boxplots.
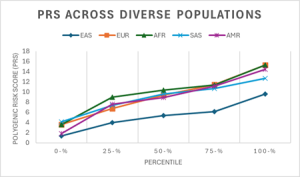
Figure 5. Line Graph of PRS Distribution across population groups.
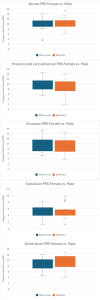
Figure 6. Box Plots of PRS Distribution across gender in each population group.
Figure 5 portrayed promising differences across population groups, so further statistical analysis was conducted to determine statistically significant differences. A one-way analysis of variance (ANOVA) test at a significance level of 0.05 was conducted to determine whether there is a statistically significant difference between the means of the main five ancestral groups or not. The conditions of normality, equality of variances, and test power were all met.
Figure 6 didn’t show promising statistically significant differences across gender within population groups, but a T-Test calculation for significance between two sample means was done for each ancestral group to ensure this prediction. The conditions of normality, independence, and equality of variance were all met.
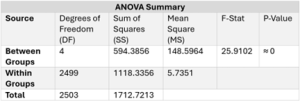
Figure 7. Table of ANOVA Test results across ancestral groups.
A one way ANOVA test is particularly helpful when looking at data with more than three groups because this test can be used to figure out if at least one or more of the groups’ mean is significantly different from the other groups’ means. In this research, this test was used as an initial measurement of the means, seeing whether one of the five ancestral groups had a statistically significantly different mean than the other groups. The one way ANOVA test revealed that, since the P-Value of ≈ 0 is less than the significance level of 0.05, the null hypothesis should be rejected. This shows that the difference between the mean PRS across the ancestral groups is statistically significant. The F-statistic is 25.91, which is not in the 95% region of acceptance (0:2.418). Since the one-way ANOVA has statistically significant results, Tukey’s Honestly Significant Difference (HSD) test is done to determine which ancestral groups were statistically significantly different from the others. This test is the second part of this significance test, and can only provide useful information if the one-way ANOVA test produces significant results. Tukey’s HSD Test revealed that the East Asian PRS is statistically significantly different from European (p=1.211e-10), African (p=1.026e-10), South Asian (p=3.172e-10), and Hispanic and Latin American (p=2.16e-10) PRS.
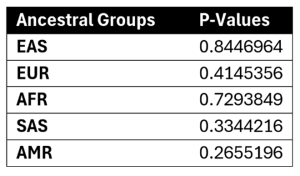
Figure 8. Table of P-Values from T-Test for Significance across gender within each ancestral group.
A T-Test for significance between two samples means is a test that can verify if the difference between two means is significant or not, and in the context of this research, the test was used to figure out if the mean PRS values across ancestral groups were statistically significant. The T-Test for significance between two sample means revealed no statistically significant difference across gender in every ancestral group. The p-values of the difference across gender in each ancestral group, East Asian (p=0.84), European (p=0.41), African (p=0.73), South Asian (p=0.33), and Hispanic and Latin American (p=0.27), were all above the significance level of 0.05, indicating no significant difference of PRS.
DISCUSSION
The hypothesis predicted that if Polygenic Risk Scores (PRS) are calculated for colorectal cancer risk across different ancestral groups, the resulting scores will exhibit significant variation between the ancestral groups (European, African, East Asian, South Asian, American) represented in the diverse genome data was proved correct through data analysis. For the PRS distribution across diverse populations, East Asian PRS was proven statistically significantly different from than the other population groups from a one-way ANOVA revealing statistically significant difference in PRS between at least two ancestral groups (F(4, 2499)= 25.91, p≈ 0) and Tukey’s HSD finding that the mean East Asian PRS was statistically significantly different compared to every other group (European (p=1.211e-10), African (p=1.026e-10), South Asian (p=3.172e-10), and Hispanic and Latin American (p=2.16e-10)). These results reflect the fact that most genetic research with PRS has been conducted with populations of European ancestry, as compared with non-European ancestry.
However, no statistically significant difference across gender was found in any ancestral group (p-values>0.05). Boxplots of the distribution of PRS across gender did show outliers in the East Asian and African ancestral groups though, which shows signs of differences that could be discovered with future research.
Limitations and Future Steps
One limitation of this study is the limited dataset. The total sample size includes 2504 individuals, but when separating the data by ancestral group to analyze differences across gender, only 501 samples for each ancestral group, with the exception of 250 samples each of East Asian and South Asian ancestral groups, could be analyzed. In the future, utilizing an even larger genomic dataset could assist in outlining more distinct differences across gender specifically. Even more diverse datasets with various ethnic groups inside the five main ancestral groups used in this study would help improve the applicability of PRS across a wider range of people. Additionally, combining PRS with other biomarkers, such as epigenetic markers, could provide a more comprehensive risk assessment.
A Polygenic Risk Score is a risk predictive measure that has great potential for applications in personalized medicine. Prevention and treatment strategies on an individual level could be improved based on individual genetic risk with this tool.
References
- Archambault AN, et al. Cumulative Burden of Colorectal Cancer-Associated Genetic Variants Is More Strongly Associated With Early-Onset vs Late-Onset Cancer. Gastroenterology. 2020 Apr;158(5):1274-1286.e12. doi: 10.1053/j.gastro.2019.12.012. Epub 2019 Dec 19. PMID: 31866242; PMCID: PMC7103489.
- Ullah, F., Pillai, A. B., Omar, N., Dima, D., & Harichand, S. (2023). Early-Onset Colorectal Cancer: Current Insights. Cancers, 15(12), 3202. https://doi.org/10.3390/cancers15123202
- Yue Zhang, Yin Wang, Bingqiang Zhang, Peifeng Li, Yi Zhao, Methods and biomarkers for early detection, prediction, and diagnosis of colorectal cancer, Biomedicine & Pharmacotherapy, Volume 163, 2023, 114786, ISSN 0753-3322, https://doi.org/10.1016/j.biopha.2023.114786.
- Ho PJ, et al. Polygenic risk scores for the prediction of common cancers in East Asians: A population-based prospective cohort study. 2023 Mar 27;12:e82608. doi: 10.7554/eLife.82608. PMID: 36971353; PMCID: PMC10159619.
- Thomas M, et al. Combining Asian and European genome-wide association studies of colorectal cancer improves risk prediction across racial and ethnic populations. Nat Commun. 2023 Oct 2;14(1):6147. doi: 10.1038/s41467-023-41819-0. PMID: 37783704; PMCID: PMC10545678.
- Zhang, H., Zhan, J., Jin, J. et al.A new method for multiancestry polygenic prediction improves performance across diverse populations. Nat Genet 55, 1757–1768 (2023). https://doi.org/10.1038/s41588-023-01501-z
- Thomas M, et al. Genome-wide Modeling of Polygenic Risk Score in Colorectal Cancer Risk. Am J Hum Genet. 2020 Sep 3;107(3):432-444. doi: 10.1016/j.ajhg.2020.07.006. Epub 2020 Aug 5. PMID: 32758450; PMCID: PMC7477007.


