Using Bioinformatics to Identify Potential Target Genes for Multiple Sclerosis Treatments

ABSTRACT
Background
Multiple Sclerosis (MS) is a progressive autoimmune disease affecting the central nervous system (CNS), primarily in young Caucasian adults. It damages the myelin sheath around neurons, leading to symptoms such as numbness, pain, muscle weakness, and cognitive issues. With no cure and limited treatment options, this study aims to identify target genes for MS treatment using bioinformatics tools to analyze gene expression and enrichment.
Methods
Bioinformatics tools NCBI GEO2R and SRplot for GO and KEGG analysis were used to study dataset GSE239698. Groups included RELA (RelA-deficient), REL (Rel-deficient), and WT (wild-type, normal). GEO2R was used to identify differentially expressed genes (DEGs), which were further analyzed with SRPlot for GO and KEGG pathway enrichment.
Results
The analysis identified 27 DEGs, with 24 upregulated and 3 downregulated. GO analysis revealed enrichment in terms including CD83, RIPK2, and the IKK pathway. KEGG analysis highlighted pathways such as NF-kB, cIAP1, and cIAP2. The NF-kB pathway was a common finding in both analyses, indicating its significant role in MS.
Conclusion
Key genes like cIAP1/2, CD83, and RIPK2 play crucial roles in inflammation and immune regulation in MS. Inhibiting these genes could offer therapeutic benefits, though careful monitoring is needed to avoid side effects such as immune dysfunction or excessive cell death. This study provides valuable insights into gene-pathway relationships in MS, paving the way for future research and potential treatments targeting these pathways.
KEYWORDS: Multiple Sclerosis (MS), GEO2R, SR Plot, GO, KEGG, NCBI, cIAP1/2, CD83, RIPK2
INTRODUCTION
Multiple Sclerosis (MS) is an autoimmune disease that affects the brain and spinal cord, or the central nervous system (CNS) (1). During MS, the immune system mistakenly attacks the myelin sheath of neurons in the brain, spinal cord, and optic nerves. The immune system sends immune cells, such as Tconv cells, to the CNS, where they attack the myelin sheath. This destruction of the myelin sheath causes inflammation around it, ultimately damaging it. The damage to the myelin causes nerve signals to slow down and become less efficient. As the disease progresses, the damaged myelin turns into sclerosis (scar tissue), which makes it extremely difficult for nerve signals to pass through the CNS (2). Multiple Sclerosis (MS) has no cure and limited treatment options. In this research paper, the relationship between MS and gene expression with different genes was studied to find a possible treatment or advancement in treatment for MS patients.
The scientific question being investigated in this study is which gene is most expressed or relevant in the context of MS. The research conducted in this experiment will help identify which genes are highly enriched and expressed in MS. Additionally, it will help identify possible genes that could be targeted for MS treatments.
MS is known to not have a specific cause, but rather many factors that may increase the likelihood of developing it. MS is most commonly diagnosed in young adults and is more prevalent in women, who are more likely than men to develop the disease (1). It is also more common in individuals of Caucasian descent. Other factors, such as smoking, obesity, and exposure to toxins, can increase the risk of MS (3). MS can affect the physical, mental, and cognitive health of those affected (1).
Bioinformatics continues to help researchers learn more about MS. Aspects that have already been studied using bioinformatics include genetic risk factors, Tconv involvement in inflammation, environmental and molecular factors that influence MS, and components of the NF-kB pathway. However, the exact cause of MS is still unknown, and there is no cure for this disease. Bioinformaticians still face challenges in diagnosing the disease in its early stages.
The objective of this research is to use bioinformatics tools and databases to further investigate and identify genes that can be targeted for treatments of Multiple Sclerosis. The bioinformatics tools used in this study were the National Center for Biotechnology Information (NCBI) Gene Expression Omnibus (GEO2R), Scientific and Research Plot Tool (SRplot), Kyoto Encyclopedia of Genes and Genomes (KEGG), and Gene Ontology (GO). Specifically, NCBI GEO2R is a database where genomic data is submitted by researchers conducting experiments for others to analyze the results (4). Additionally, SRplot, KEGG, and GO bioinformatics were used to further analyze the results obtained from GEO2R. SRplot is a web server used to generate graphs and visualizations for many bioinformatics areas, including genomics (5). KEGG is a bioinformatics database that assigns functional meanings to genes and genomes and deals with biological pathways at molecular and higher levels (6). GO is an online bioinformatics database regarding gene and genome functions (7).
My hypothesis is that the gene RelA will be the most highly expressed gene in MS patients and the least expressed in healthy patients. This research is important for advancing treatment options for MS patients. By highlighting the potential of targeting specific genes as a possible treatment, this study lays the groundwork for future research that could lead to the development of new therapies for MS.
METHODS
Collection of Data Using NCBI GEO Bioinformatics Tool
To start the research process, the dataset GSE239698 was selected from the National Center for Biotechnology Information (NCBI) GEO sets (4). The chosen dataset, titled “NF-κB transcription factors RelA and c-Rel selectively control CD4+ T-cell function in multiple sclerosis and cancer [bulk_human]”, was originally created to explore how Tconv cells react without the RelA and c-Rel genes.

Figure 1. Research Methodology: Flow chart of the summary of methods and bioinformatics tools used in this research.
GEO2R Analysis
For the GEO2R analysis of this dataset, the 10 samples were separated into 3 groups: RELA, REL, and WT. The RelA group consisted of 3 samples, the REL group consisted of 3 samples, and the WT group consisted of 4 samples. Once the groups were defined, GEO2R analysis was performed to identify the differentially expressed genes (DEGs) and generate a variety of graphs depicting gene expression. The programming language used for the GEO2R analysis can be found in the R script (R script). From the analysis results, the Volcano Plot, Venn Diagram, and DEGs were utilized in this study. The DEGs generated from the GEO2R analysis all had a p-value less than 0.05.
Narrowing down differentially expressed genes using statistics
To identify the most significant differentially expressed genes, the entire list of DEGs from GEO2R was downloaded and transferred to a Google Sheet. Out of the 17,331 DEGs obtained from the GEO2R analysis, 30 were chosen for deeper analysis (Top 30 DEGs). These 30 genes were selected based on having the lowest p-values among the 17,331 genes.
SR Plot Analysis to determine the potential functions of the genes
To further analyze the 27 DEGs, the SR Plot online web server was used to assign functions to the genes. The gene symbols and log2 fold changes (log2FC) were input into GO and pathway enrichment analysis in SR Plot for functional analysis. Upon completion of the analysis, a variety of graphs and visualizations were generated. These visualizations were grouped into two key categories: GO and Pathway. The GO and KEGG Pathway graphs were explored to find specific genes that were highly enriched. The genes that showed high enrichment and important functions in MS were chosen for further study.
RESULTS
Identification of Differentially Expressed Genes
The first bioinformatics tool used to identify the DEGs of the chosen dataset was GEO2R in NCBI. The DEGs were presented in the form of a table as a result of the GEO2R analysis.
In the volcano plot generated from the GEO2R analysis, the red dots represent upregulated genes, meaning they are highly expressed, and the blue dots represent downregulated genes, meaning they are expressed less than usual. The black dots represent genes that are not statistically significant.
From the Venn diagram produced from the GEO2R analysis, a total of 17,331 genes were identified. The Venn diagram revealed that the WT vs RelA comparison had 23 overlapping DEGs, the RelA vs REL comparison had 8 overlapping DEGs, and the overlap between WT vs RelA and RelA vs REL had 21 overlapping DEGs.
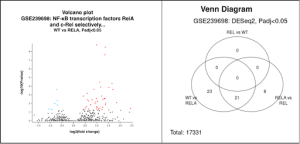
Figure 2. Identification of differentially expressed genes from collected samples: A Volcano plot shows gene expression sorted by -log10 (Pvalue and log2(fold change) between the RelA and WT groups. Each dot is a gene that is differentially expressed among the different groups. The upregulated genes are shown as red dots, while the downregulated genes are shown as blue dots. The top DEG from this graph was the NFKB2, followed closely by STARD10 and ANKRD33B. B. The Venn diagram shows the relationship between the RELA, REL, and WT groups, revealing that many DEGs overlap between the groups.
Identification of 30 Statistically Significant Differentially Expressed Genes (DEGs)
The statistical method used to narrow down the DEGs from the table was the P-value. Genes with the lowest P-values were selected because a low P-value indicates statistical significance. A total of 27 top DEGs were identified based on their P-values. Of the 27 genes identified, 3 were downregulated and 24 were upregulated. Top 27 DEGs
Potential Functions and Enrichment of the Identified Genes
The bioinformatics enrichment tool used to determine the potential functions of the genes was SR Plot. The most significant pathway identified from the KEGG results was the NF-kB (Nuclear Factor kappa B) signaling pathway. This pathway plays a crucial role in MS. In MS, the NF-kB pathway becomes overactive in immune and brain cells, leading to inflammation and driving the immune system to attack the body’s own tissues (8). Using the pathway graph in Figure 3, genes involved in the NF-kB pathway were identified.
The genes that repeatedly appeared and were considered the most significant from the NF-kB pathway graph were cIAP1 and cIAP2 (Cellular Inhibitor of Apoptosis Protein 1 and 2). These genes play a crucial role in activating the NF-kB pathway. When cIAP1 and cIAP2 become overactivated, they can directly lead to the overactivation of the NF-kB pathway (9).
The pathway that repeatedly appeared in the GO results was the IκB kinase (IKK) pathway. IKK is a protein complex that is key for regulating NF-kB activation (10).
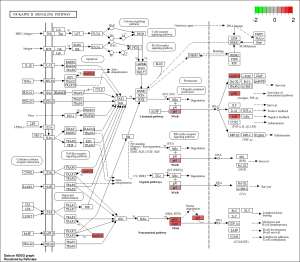
Figure 3. KEGG Results NF-KAPPA B signaling pathway: In this graph, green represents low significance, while red represents high significance in the pathway. The most significant genes in this pathway were identified as cIAP1 and cIAP2 (cIAP1/2).
The GO results highlighted two main genes: Cluster of Differentiation 83 (CD83) and Receptor-Interacting Protein Kinase 2 (RIPK2). The CD83 gene is important for dendritic cell activation and regulation. However, at elevated levels, CD83 is associated with the worsening of autoimmune diseases (11). The RIPK2 gene encodes a protein that helps activate dendritic cells. When RIPK2 is activated, it can lead to inflammation within the cell (12).

Figure 4. GO Analysis: A. The Go Results of Three Ontologies bar graph displays three ontologies and their enrichment within the genes analyzed. Orange represents Biological Processes (BP), green represents Cellular Components (CC), and blue represents Molecular Functions (MF). The BP ontology is significantly more enriched than CC and MF. The most enriched result in BP was the I-kappaB kinase (IKK) pathway. B. The Biological Processes dot plot shows the enrichment score, p-value, and count for each biological process. The top biological process identified is the I-kappaB kinase (IKK) pathway.
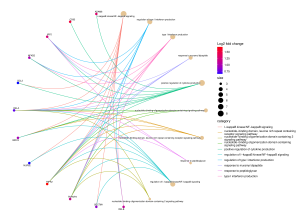
Figure 5 BP cnetplot: This cnetplot displays significant genes and the categories they are connected to. The most significant genes are shown in bright red, which represents a high Log2 fold change (Log2fc). The top genes in this plot are CD83 and RIPK2.
DISCUSSION
The main goal of this research was to identify key genes that could serve as potential targets for treatment using various bioinformatics tools. The results from the GEO2R and SRplot analyses revealed several genes and pathways that were consistently involved in significant pathways and showed high enrichment.
The significant genes identified in the graphs and tables could potentially serve as targets for MS treatments. The cIAP1/2, CD83, and RIPK2 genes (Figures 3 and 5) play key roles in the inflammation associated with MS (9, 10, 11, 12, 13, 14).
cIAP1 and cIAP2 (cIAP1/2) are two genes that appeared repeatedly in the NF-kB pathway graph (Figure 3). These genes play a crucial role in activating the NF-kB pathway and regulating immune cells that attack the CNS. Previous studies have shown that when cIAP1/2 genes become dysfunctional, they send uncontrolled signals to immune cells, leading to tissue damage and inflammation observed in MS (10). By precisely targeting these genes, their inhibition in MS patients could prevent the unchecked immune responses. However, since cIAP1/2 genes are important for preventing apoptosis, their inhibition could result in excessive cell death, which may lead to severe side effects. If cIAP1/2 inhibitors become a viable treatment for MS, close patient monitoring would be essential to prevent potentially dangerous side effects.
CD83 plays a key role in the maturation of dendritic cells, which act as messengers between different parts of the immune system and help activate immune cells. While healthy dendritic cells are crucial for the body’s defense, abnormal dendritic cells contribute to inflammation and tissue damage seen in MS (13). Further research may reveal that inhibiting CD83 could prevent abnormal dendritic cells from maturing, potentially offering a treatment for MS. However, such a treatment would require extensive laboratory and animal studies before testing in humans. If not carefully controlled, inhibiting CD83 could halt the maturation of all dendritic cells, severely compromising the immune system and increasing vulnerability to infections (11).
RIPK2 is a crucial gene that activates the NF-kB pathway and helps regulate dendritic cells. It also plays a role in regulating cytokines, which are proteins released by cells to facilitate communication between them. Elevated levels of pro-inflammatory cytokines contribute to the inflammation seen in MS (14). In the future, RIPK2 inhibitors may be used as a treatment, but further research is needed to fully understand their effects. By targeting RIPK2 in MS patients, it may be possible to prevent inflammation driven by high cytokine levels and dysfunctional dendritic cells. With careful research, testing, and clinical trials, RIPK2 inhibitors could become a promising treatment for MS.
Table 1. Summary of Identified Genes and Pathways
Gene | Function | Gene Name | Connection |
cIAP1/2 |
| Cellular Inhibitor of Apoptosis Protein 1 and 2 | Keeps immune cells, which attack the CNS, alive |
CD83 |
| Cluster of Differentiation 83 | Elevated levels of CD83 is linked to MS inflammation |
RIPK2 |
| Receptor-Interacting Protein Kinase 2 | Promotes neuroinflammation and activated immune cells which attack the CNS |
Overall, the genes identified in this study could be tested in the laboratory or through clinical trials to determine whether the benefits of targeting these genes outweigh the potential risks.
One limitation of this research was the small sample size of the dataset used. Additionally, the study relied solely on secondary research, and no access to a laboratory was available for further investigation of the genes. The identified genes will need to be studied in greater depth in a laboratory setting before any potential treatments for MS patients can be fully developed.
References
Yang, M., Sun, L., Han, J., Zheng, C., Liang, H., Zhu, J., & Jin, T. (2019). Biological characteristics of transcription factor RelB in different immune cell types: implications for the treatment of multiple sclerosis. Molecular Brain, 12(1). https://doi.org/10.1186/s13041-019-0532-6
Guilhem Lalle, Raphaëlle Lautraite, Khaled Bouherrou, Plaschka, M., Pignata, A., Voisin, A., Twardowski, J., Marlène Perrin-Niquet, Stéphan, P., Durget, S., Tonon, L., Ardin, M., Degletagne, C., Alain Viari, Dutron, L. B., Davoust, N., Postler, T. S., Zhao, J., Christophe Caux, & Caramel, J. (2024). NF-κB subunits RelA and c-Rel selectively control CD4+ T cell function in multiple sclerosis and cancer. The Journal of Experimental Medicine, 221(6). https://doi.org/10.1084/jem.20231348
- Adamczyk- Sowa M, Gębka- Kępińska B, Kępiński M. MULTIPLE SCLEROSIS – RISK FACTORS. Wiadomości Lekarskie. 2020;73(12):2677–82.
- Barrett T, Wilhite SE, Ledoux P, Evangelista C, Kim IF, Maxim Tomashevsky, et al. NCBI GEO: archive for functional genomics data sets—update. Nucleic Acids Research [Internet]. 2012 Nov 26 [cited 2025 Jan 13];41(D1):D991–5. Available from: https://pubmed.ncbi.nlm.nih.gov/23193258/
- Tang D, Chen M, Huang X, Zhang G, Zeng L, Zhang G, et al. SRplot: A free online platform for data visualization and graphing. PLoS ONE [Internet]. 2023 Nov 9 [cited 2025 Jan 13];18(11):e0294236–6. Available from: https://pubmed.ncbi.nlm.nih.gov/37943830/
- Minoru Kanehisa, Miho Furumichi, Tanabe M, Sato Y, Morishima K. KEGG: new perspectives on genomes, pathways, diseases and drugs. Nucleic Acids Research [Internet]. 2016 Oct 26 [cited 2025 Jan 13];45(D1):D353–61. Available from: https://pubmed.ncbi.nlm.nih.gov/27899662/
- The Gene Ontology Resource: 20 years and still GOing strong. Nucleic Acids Research [Internet]. 2018 Nov 5 [cited 2025 Jan 13];47(D1):D330–8. Available from: https://pubmed.ncbi.nlm.nih.gov/30395331/
- Lin W, Yue Y, Stone S. Role of nuclear factor κB in multiple sclerosis and experimental autoimmune encephalomyelitis. Neural Regeneration Research [Internet]. 2018 Jan 1 [cited 2025 Jan 17];13(9):1507–7. Available from: https://pmc.ncbi.nlm.nih.gov/articles/PMC6126134/
- Mahoney DJ, Cheung HH, Mrad RL, Plenchette S, Simard C, Enwere E, et al. Both cIAP1 and cIAP2 regulate TNFα-mediated NF-κB activation. Proceedings of the National Academy of Sciences [Internet]. 2008 Aug 19 [cited 2025 Jan 18];105(33):11778–83. Available from: https://www.pnas.org/doi/abs/10.1073/pnas.0711122105
- Solt LA, May MJ. The IκB kinase complex: master regulator of NF-κB signaling. Immunologic Research [Internet]. 2008 Jul 14 [cited 2025 Jan 18];42(1-3):3–18. Available from: https://pmc.ncbi.nlm.nih.gov/articles/PMC2965074/
- Sajad Karampoor, Hamid Zahednasab, Masoud Etemadifar, Hossein Keyvani. The levels of soluble forms of CD21 and CD83 in multiple sclerosis. Journal of Neuroimmunology [Internet]. 2018 Apr 13 [cited 2025 Jan 18];320:11–4. Available from: https://www.sciencedirect.com/science/article/abs/pii/S016557281830064X
- Shaw PJ, Barr MJ, Lukens JR, McGargill MA, Chi H, Mak TW, et al. Signaling via the RIP2 Adaptor Protein in Central Nervous System-Infiltrating Dendritic Cells Promotes Inflammation and Autoimmunity. Immunity [Internet]. 2011 Jan 1 [cited 2025 Jan 18];34(1):75–84. Available from: https://pmc.ncbi.nlm.nih.gov/articles/PMC3057380/
- AH Nuyts, Lee W, R Bashir-Dar, ZN Berneman, Cools N. Dendritic cells in multiple sclerosis: key players in the immunopathogenesis, key players for new cellular immunotherapies? Multiple Sclerosis Journal [Internet]. 2013 Jan 31 [cited 2025 Jan 19];19(8):995–1002. Available from: https://pubmed.ncbi.nlm.nih.gov/23369893/
- Zhang JM, An J. Cytokines, Inflammation, and Pain. International Anesthesiology Clinics [Internet]. 2007 Jan 1 [cited 2025 Jan 19];45(2):27–37. Available from: https://pmc.ncbi.nlm.nih.gov/articles/PMC2785020/
- Yan, J., Winterford, C. M., Catts, V. S., Pat, B. K., Pender, M. P., McCombe, P. A., & Greer, J. M. (2018). Increased constitutive activation of NF-κB p65 (RelA) in peripheral blood cells of patients with progressive multiple sclerosis. Journal of Neuroimmunology, 320, 111–116. https://doi.org/10.1016/j.jneuroim.2018.04.002
- Manuel, A. M., Dai, Y., Freeman, L. A., Jia, P., & Zhao, Z. (2020). Dense module searching for gene networks associated with multiple sclerosis. BMC Medical Genomics, 13(S5). https://doi.org/10.1186/s12920-020-0674-5
- Riaz B, Islam S, Ryu H, Sohn S. CD83 Regulates the Immune Responses in Inflammatory Disorders. International Journal of Molecular Sciences [Internet]. 2023 Feb 1 [cited 2025 Jan 19];24(3):2831. Available from: https://pmc.ncbi.nlm.nih.gov/articles/PMC9917562/

