Investigating Genetic Associations with Parkinson’s Disease Using Bioinformatics

Investigating Genetic Associations with Parkinson's Disease Using Bioinformatics - Maya Sammanna
ABSTRACT
Introduction
Parkinson’s Disease (PD) is a progressive neurodegenerative disorder characterized by motor (tremors, stiffness, and bradykinesia) and non-motor symptoms (pain, cognitive impairment, and sleep disturbances). However, the exact causes of Parkinson’s disease are not fully understood, but there is growing evidence indicating a significant genetic contribution. Therefore, to fill this gap, this study aimed to identify differentially expressed genes (DEG’s) in PD patients compared to healthy controls, shedding light on genetic factors and pathways involved in PD pathogenesis.
Methods
Various bioinformatics databases and tools were used to conduct this study. First RNA sequencing data from the Gene Expression Omnibus (GEO) database (GSE168496) was analyzed. This study used post-mortem brain tissue samples from 8 PD patients and 8 healthy controls. The GEO2R bioinformatics tool was used to analyze and identify differentially expressed genes (DEGs) between PD patients and healthy samples. Based on fold change and p-value criteria, the top 30 DEGs were subjected to Gene Ontology (GO) and KEGG enrichment analyses using SR Plot to determine potential functions and biological pathways of the top DEGs.
Results
The GEO2R and SR Plot analyses identified several DEGs between PD patients and healthy samples, including SLC6A3 and PITX3, which were upregulated in PD patients. GO enrichment analysis revealed several enriched biological pathways and cellular components associated with the top DEG’s, such as locomotory behavior, dopaminergic neuron differentiation, and neurotransmitter transport. KEGG pathway analysis highlighted active pathways, including dopamine metabolism and synaptic transmission. The enriched pathways underscore the involvement of dopaminergic systems in PD.
Discussion
The findings emphasize the relevance of dopaminergic pathways in PD, with SLC6A3 and PITX3 identified as key genes. These genes play crucial roles in dopamine reuptake and neuron differentiation, respectively, aligning with PD pathology. The results suggest potential biomarkers and therapeutic targets, contributing to the understanding of PD’s genetic basis.
This study identified significant DEGs and enriched pathways in PD, highlighting genes like SLC6A3 and PITX3. These insights advance the understanding of PD’s genetic foundations and suggest targets for therapeutic intervention.
KEYWORDS: Parkinson’s disease, Bioinformatics, NCBI, GEO, dopaminergic pathways, SR Plot, Gene Ontology, KEGG
INTRODUCTION
Parkinson’s disease (PD) is a progressive neurodegenerative disorder that affects movement (Khan et al, 2018). It causes symptoms such as tremors, stiffness, and bradykinesia (slowness of movement). The exact causes of Parkinson’s disease are not fully understood, but there is growing evidence indicating a significant genetic contribution (Clarke, 2007). The research aims to address specific genetic factors associated with Parkinson’s disease, which could lead to improved diagnostic methods and treatment approaches.
This study aims to determine if there is a difference in the expression of specific genes in people with Parkinson’s disease compared to those who are healthy. The research specifically seeks to identify which genes exhibit changed expression patterns in Parkinson’s disease patients, with the goal of enhancing our understanding of the genetic foundations of the illness.
Parkinson’s disease is the second most common neurodegenerative disorder after Alzheimer’s disease (Alexander, 2004). It primarily affects individuals over the age of 60, although early-onset Parkinson’s can occur. The disease is characterized by the degeneration of dopamine-producing neurons in the substantia nigra, a region of the brain crucial for movement control (Klockgether, 2004). This loss of dopamine leads to the hallmark motor symptoms of Parkinson’s disease. Non-motor symptoms, such as cognitive decline, mood disorders, and sleep disturbances, also significantly impact patients’ quality of life (Tomlinson et al, 2013).
Parkinson’s disease affects millions of people worldwide, with a substantial economic, health and social burden (Kowal et al, 2013). The exact cause of neuron degeneration in Parkinson’s is not fully understood, but a combination of genetic, environmental, and lifestyle factors is believed to contribute. Several genes, such as SNCA, LRRK2, and PARK2, have been implicated in familial forms of Parkinson’s, but these account for around 10% small percentage of cases (Clarke, 2007). The majority of cases are sporadic (a type of Parkinson’s), with a more complex interplay of genetic predisposition and environmental triggers.
Bioinformatics has become an essential tool in Parkinson’s disease research, enabling the analysis of large-scale genomic and transcriptomic data. For example, previous bioinformatics studies have identified various genetic variants and expression profiles associated with Parkinson’s disease (Diao et al., 2012). These studies have provided insights into potential molecular pathways involved in the disease, such as mitochondrial dysfunction, oxidative stress, and protein aggregation (Feldman, J et al, 2023).
However, despite advancements, much remains unknown about the genetic basis of Parkinson’s disease (Yao et al., 2021). Specifically, the complete spectrum of genes involved and their precise roles in the disease’s progression are not fully clear (Gasser, 2009). Additionally, the interaction between genetic factors and environmental influences in sporadic Parkinson’s cases requires further investigation (Pang et al., 2019).
Therefore, the goal of this research is to analyze gene expression profiles in Parkinson’s disease patients compared to healthy controls to identify differentially expressed genes. The hypothesis is that there will be significant differences in the expression levels of certain genes between the two groups. These differences in gene expression may reveal new molecular targets for therapeutic intervention and improve understanding of the disease mechanism.
This research is crucial for identifying genetic factors and understanding their role in Parkinson’s disease can lead to earlier diagnosis, personalized treatment approaches, and the development of new therapeutic targets. Given the growing prevalence of Parkinson’s disease, particularly in aging populations (Marras et al., 2018), this research has significant implications for public health. Therefore, advancing the knowledge of Parkinson’s disease through bioinformatics ultimately benefits patients and healthcare systems worldwide.
METHODS
Study Design
This study aimed to explore differentially expressed genes (DEGs) in Parkinson’s disease (PD) patients compared to healthy controls. A differentially expressed gene (DEG) is a gene that shows statistically significant differences in expression levels (how “active” a gene is) between two or more groups, such as diseased versus healthy patients. This difference can indicate the gene’s involvement in specific biological processes or conditions (Anjum et al., 2016). The goal was to unravel their potential implications through Gene Ontology (GO) (Thomas et al., 2021) and KEGG (Kanehisa, 2000) enrichment analyses, providing a comprehensive understanding of the genetic underpinnings of Parkinson’s disease and the molecular mechanisms possibly involved. A summary of the methodology used in this study is summarized in Figure 1.
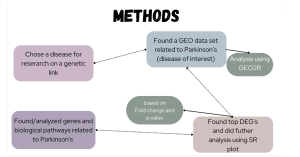
Figure 1. Methods flowchart: The flowchart above displays the methods used in this study.
Data Collection
Data for this investigation were sourced from the Gene Expression Omnibus (GEO) database (Geo, n.d.) under accession number GSE168496. The Gene Expression Omnibus (GEO) is a public database where researchers store and share genetic data from various studies (Barrett et al., 2012). The National Center for Biotechnology Information (NCBI) is a central resource for biomedical genomic information. It provides access to many databases and tools to help analyze biological data (Kalbfleisch et al., 2010). GEO2R is an online tool provided by GEO that allows users to compare gene expression levels between sample groups and simplifies the process of identifying DEG’s in data sets in the GEO database (Geo, n.d.-a). The dataset included brain tissue samples from both PD patients and age-matched healthy controls, consisting of 16 participants: 8 PD patients and 8 healthy controls. These samples were obtained post-mortem. GEO2R was employed for data preprocessing and normalization to ensure consistency and comparability across samples. This process involved categorizing samples into ‘Control’ and ‘Parkinson’s’ groups based on disease status. The GEO2R analysis used the following AI and ML-programmed R Script to generate the DEG data.
Identifying Differentially Expressed Genes (DEGs)
To identify DEGs, GEO2R utilized statistical methods and algorithms capable of analyzing RNA sequencing data (Solano et al., 2024). DEGs or differentially expressed genes are genes that show statistically significant differences in expression levels between different conditions or groups (Zhang et al., 2004). Following DEG identification, a filtering approach was implemented based on two criteria: a high fold change value and a low p-value. A high fold change value indicates that a gene is significantly upregulated/downregulated in healthy controls compared to PD patients, suggesting potential involvement in disease pathology. The second criterion, a low p-value, was applied to mitigate the risk of false positives in experiments where numerous genes are tested simultaneously.
Identifying Top DEGs
From the pool of identified DEGs, the top 30 were selected for further analysis based on their significance, with a cutoff from the p-value 4.36E-03 and a cutoff of the log fold change value 1.398. The list of all and the top thirty DEG’s chosen can be found in the Supplementary Data Top 30 DEGs.
Functional Enrichment Analysis: GO and KEGG
These top DEGs were subjected to GO and KEGG bioinformatics enrichment analysis tool SR Plot (SRplot – Science and Research Online Plot, n.d.), which categorized them into biological processes, molecular functions, and cellular components (SRplot- Science and Research Online Plot, n.d.). This bioinformatics analysis is a way to provide some insights into the specific functional roles of these DEGs in the context of Parkinson’s disease. It may reveal their involvement in key biological processes such as neuroinflammation, mitochondrial function, and neurotransmitter regulation.
Gene Ontology (GO) is a framework that categorizes genes based on their functions, biological processes, and cellular locations. This helps gain an understanding of gene roles and interactions (Gene Ontology Overview, 2024). Kyoto Encyclopedia of Genes and Genomes (KEGG) is a database that maps genes and their products to biological pathways, illustrating how they interact in various cellular processes and disease mechanisms (Kanehisa, 2000).
Additionally, KEGG (KEGG Database, n.d.) pathway analysis using SR Plot identified biological pathways potentially disrupted in PD. This analysis highlighted pathways such as dopamine metabolism, oxidative stress response, and synaptic transmission pathways, shedding light on critical mechanisms underlying PD pathogenesis and potential therapeutic targets. Enrichment analysis involved calculating scores and p-values to assess the significance of associations between DEGs and specific KEGG pathways.
Data Presentation and Interpretation
Visual tools like bar plots, dot plots, and cnet plots were used to effectively present and interpret the data. This helped to identify potential gene functions and key biological themes and insights. The analysis laid the groundwork for further research into targeted therapies and interventions aimed at reducing the impact of the disease on affected individuals.
RESULTS
GEO2R Analysis
Analysis of this dataset using GEO2R from the volcano plot and Venn diagram reveals that some genes were differentially expressed between control (healthy) and PD patients (Figures 2 and 3).
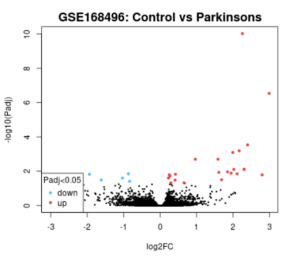
Figure 2. GEO2R Volcano Plot. The resulting volcano plot of the data after GEO2R analysis is pictured above. The blue dots represent genes that are downregulated in Parkinson’s patients, and the red dots represent genes that are upregulated in Parkinson’s patients. The black dots are genes that have the same amount of expression between Parkinson’s patients and healthy controls.
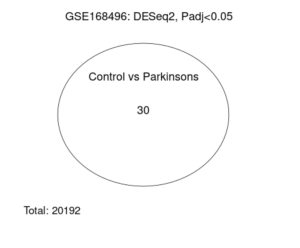
Figure 3. GEO2R Venn Diagram. The following Venn diagram was taken as the result of the GEO2R analysis. The number thirty inside the circle represents the number of genes that were differentially expressed between the two groups, out of a total of 20192 genes.
Differentially Expressed Gene Selection
Based on the fold change and p-value with a cutoff of 4.36E-03 for the p-value and a cutoff of 1.398 for the log fold change value, the top thirty DEG’s were selected for further analysis. These genes can be found in the supplementary results here: Top 30 DEGs From these selected genes, all thirty were upregulated.
SR Plot GO Enrichment Analysis
To determine the potential functions of the top 30 DEGs and their associated biological pathways, results from the GO enrichment pathway analysis in SR plot reveal several enriched pathways (Figure 4). The top 30 differentially expressed genes with an enrichment score cutoff of 6 were considered significant. Notably, biological processes (BP) such as locomotory behavior, dopaminergic neuron differentiation, neurotransmitter transport, amine transport, and dopamine metabolic processes show high enrichment scores. Similarly, the cellular component (CC) pathway of dopaminergic synapse also stands out. However, molecular function (MF) pathways exhibit low activity. The dot plot of biological processes (Figure 5) further confirms the significant activity of pathways like locomotory behavior, dopaminergic neuron differentiation, and neurotransmitter transport.
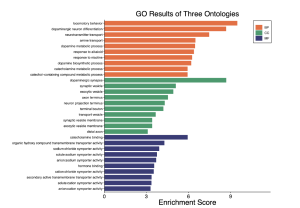
Figure 4. GO enrichment results from SR plot. The orange color represents BP (biological processes), the green represents CC (cellular component), and MF (molecular function). The bar graph displays that mostly biological processes and some cellular components are involved.
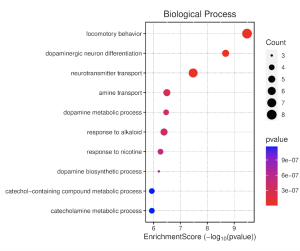
Figure 5. Biological Processes Dotplot. This shows enrichment scores for various biological process (BP) pathways. Dot size (count) reflects the number of genes in each pathway. Redder dots indicate higher statistical significance (lower p-value). A higher enrichment score suggests these pathways are more likely to be relevant to your study genes.
In the cellular component pathways, dopaminergic synapse, synaptic vesicle, and exocytic vesicle are notably enriched (Figure 6). The emapplot of biological processes (Figure 7) emphasizes the high enrichment of locomotory behavior and neurotransmitter transport pathways, while the emapplot of the cellular component (Figure 8) highlights the activity of pathways such as dopaminergic synapse and synaptic vesicle.
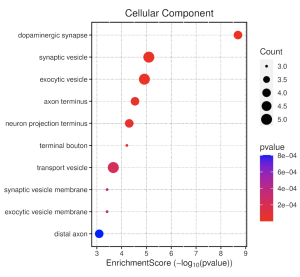
Figure 6. Cellular Component Dotplot. This dot plot shows enrichment scores for different GO terms related to cellular components (CC). The size of the dot (count) depicts the number of genes associated with that GO term. A more red-colored dot indicates a lower p-value (higher statistical significance), meaning the GO term/function is more relevant than by chance.
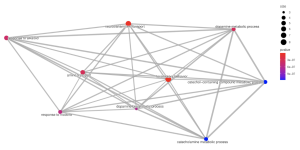
Figure 7. Emapplot of Biological Processes. This plot visualizes the results of enrichment analysis for pathways of biological processes. The larger circles represent more enriched pathways and the redder color represents more statistical significance.
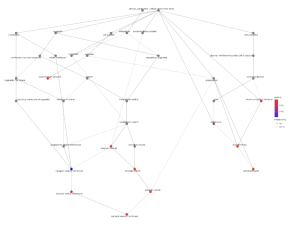
Figure 8. Emapplot for Cellular Component. The plot above displays the results of enrichment analysis for pathways of the cellular component. The larger circles represent more enriched pathways and the redder color represents more statistical relevance.
From the biological processes cnet plot (Figure 8), several genes are linked to enriched pathways. For instance, SLC6A3 is connected to pathways such as locomotory behavior, response to alkaloid, response to nicotine, and neurotransmitter transport, while PITX3 is also associated with these pathways. In the cellular component cnet plot (Figure 9), SLC6A3 is involved in the dopaminergic synapse pathway.
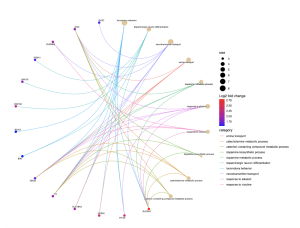
Figure 9. Cnet Plot for Biological Processes
The BP cnet plot displays the genes associated with different pathways within biological processes and connected by different colored lines. A higher log fold change value represents higher statistical importance, and the size represents the count.
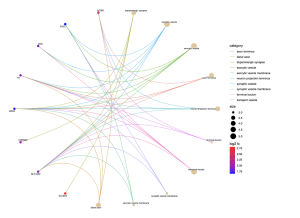
Figure 10. Cnet plot for Cellular Component. The CC cnet plot displays the genes associated with different pathways within the cellular component, showing an association between the gene and pathway by different colored lines. A higher log fold change value represents higher statistical importance, and the size represents the count/number of genes associated.
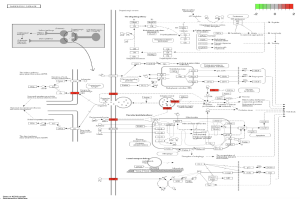
In the path view of Parkinson’s disease (Figure 10), genes such as DAT, D2, VMAT, and TH are active at various stages of the disease. Some key biological pathways and functions are locomotory behavior, dopaminergic synapse, and dopaminergic neuron differentiation. Genes such as SLC6A3 and PITX3 were prevalent in this analysis.
Figure 11. Diagram of Parkinson’s Pathway. The pathview above shows the pathway of Parkinson’s disease and at which stage different genes are involved. The highlighted colors represent the level of enrichment associated with these genes.
Supplementary Materials
Supplementary Table 1: Top 30 DEGs.
Supplementary Figure 1: R Script used to generate DEGs
DISCUSSION
This study investigated the genetic factors associated with Parkinson’s disease by using different bioinformatics tools. First, we compared gene expression profiles between affected individuals and healthy controls in the GEO Dataset ID GSE168496. The GEO2R analysis displayed that there were several upregulated and downregulated genes between the two groups (Figure 2). Key findings include significant differential expression in genes involved in biological and molecular pathways such as locomotory behavior, dopaminergic synapse function, and dopaminergic neuron differentiation. Notably, genes like SLC6A3, which is essential for dopamine reuptake (Reith et al. 2021), and PITX3, which plays a role in dopaminergic neuron development (Wang et al. 2023), were prevalent in this analysis. These results highlight the central role of dopaminergic pathways in Parkinson’s disease and identify potential biomarkers and therapeutic targets for further investigation.
The Gene Ontology (GO) and KEGG pathway analyses reveal that the differentially expressed genes (DEGs) are significantly involved in key biological processes and pathways relevant to Parkinson’s disease. The GO enrichment analysis highlighted several critical pathways, including locomotory behavior, dopaminergic neuron differentiation, and several others. These findings suggest that the upregulated DEGs are heavily involved in the dopaminergic systems and processes disrupted in Parkinson’s disease. The enrichment in the dopaminergic synapse displays the importance of this cellular component in the disease. Similarly, KEGG pathway analysis identified several enriched pathways associated with dopaminergic signaling and neurodegenerative processes, aligning with the known pathology of Parkinson’s disease. The presence of key genes like SLC6A3 and PITX3 in these pathways reinforces their relevance for understanding and targeting Parkinson’s disease mechanisms.
This study adds to the understanding of the genetic foundations of Parkinson’s disease (PD) by examining the roles of both SLC6A3 and PITX3 genes. The findings suggest that the SLC6A3 gene is associated with cognitive performance and brain activation in PD patients. This aligns with the research of Habak et al. (2014), who found that PD patients with a certain version of the SLC6A3 gene (the 9-repeat allele) showed less brain activity in the prefrontal cortex and premotor cortex compared to patients with a different version (the 10-repeat allele). Additionally, another study indicated a specific SNP (a variation in a single nucleotide) in SLC6A3 is associated with increased PD risk in Caucasians (Jiménez-Jiménez et al. 2013). They found that an SNP in the promoter region of the SLC6A3 gene is linked to a higher risk of PD in Caucasians. Other studies observed that variations in the PITX3 gene are linked to PD. Bäckström et al. (2017) found that PITX3 variants are associated with early-onset PD in Caucasians. Furthermore, Zhai et al. (2014) reported that the PITX3 C allele increases the risk of developing Parkinson’s disease dementia (PDD) and visuospatial dysfunction in PD patients, as well as a higher incidence of visual hallucinations. These findings suggest that PITX3 significantly contributes to the neurobiology and genetic landscape of PD. These studies underscore the importance of considering genetic and demographic diversity when investigating PD, as the impact of genetic variants such as those in SLC6A3 and PITX3 can be highly specific to different populations. Future research should continue to explore these variations to better understand how genetic factors interact with demographic characteristics in Parkinson’s disease.
The findings of this study have significant implications for the understanding and treatment of Parkinson’s disease (PD). Identifying key genetic factors, such as variations in the SLC6A3 and PITX3 genes that influence PD risk and progression can help grasp a better understanding of the underlying mechanisms of the disease. This knowledge could be critical in developing targeted therapies aimed at these specific genetic variations. For example, treatments that modulate the activity of the SLC6A3 gene could potentially enhance cognitive function and brain activity in PD patients. Additionally, a better understanding of the role of PITX3 in early-onset PD and dementia could lead to the development of preventive strategies or therapies that specifically target the pathways affected by this gene. Ultimately, these findings could lead to personalized medicine approaches, where treatments are tailored based on an individual’s genetic profile, thereby improving the efficacy and outcomes of PD treatments. Moreover, these insights might contribute to the development of diagnostic tools that can identify individuals at higher risk of PD, allowing for earlier intervention and management of the disease.
Table 1. Summary
Category | Pathway/function | Genes involved |
Biological Processes | Locomotory behavior | SLC6A3, PITX3 |
Biological Processes | Dopaminergic neuron differentiation | PITX3 |
Cellular Component | Dopaminergic synapse | SLC6A3 |
Cellular Component | Synaptic Vesicle | SLC6A3 |
A key limitation of the study is that it relies on RNA sequencing data from experiments conducted by other researchers. This is a concern because, while these findings point to potentially important genes and pathways, they are based on pre-existing data rather than direct experiments conducted in our own lab. Therefore, additional laboratory or clinical research is needed to validate these findings. Without conclusive validation, there is uncertainty about the accuracy and applicability of our results for developing new treatments or vaccines.
Future research should focus on several key areas. First, the identified genes and pathways should be further investigated in the laboratory through experimental studies to confirm their roles in Parkinson’s disease. Additionally, clinical trials should be conducted to assess how targeting these genes might influence disease progression or symptom management in patients. By translating our bioinformatics findings into experimental and clinical settings, researchers can determine the practical implications of these genes and pathways for developing targeted therapies or preventive strategies for Parkinson’s disease.
Conclusion
This study aimed to identify differences in the expression of genes of individuals with Parkinson’s Disease (PD) and healthy control patients. The hypothesis was that certain genes would exhibit differences in expression between these two groups. The analysis, using GEO2R and SRPlot, confirmed the hypothesis, and displayed several differentially expressed genes associated with biological pathways and cellular components involved in PD. Genes such as SLC6A3 and PITX3 were linked to pathways such as locomotory behavior, dopaminergic synapse, and dopaminergic neuron differentiation, highlighting their potential roles in the disease mechanism. These findings contribute to our understanding of the genetic factors underlying Parkinson’s disease and suggest new molecular targets for therapeutic intervention. Future research should focus on validating these DEGs in larger, diverse populations and exploring the interactions between genetic and environmental factors in PD. Further studies could also investigate the therapeutic potential of targeting these genes and pathways to develop more effective treatments for Parkinson’s disease.
References
- About GEO2R – GEO. NCBI, https://www.ncbi.nlm.nih.gov/geo/info/geo2r.html. Accessed 11 July 2024.
- Alexander, G. E. “Biology of Parkinson’s Disease: Pathogenesis and Pathophysiology of a Multisystem Neurodegenerative Disorder.” Dialogues in Clinical Neuroscience, 2004, pp. 259–280. https://doi.org/10.31887/dcns.2004.6.3/galexander.
- Anjum, A., Jaggi, S., Varghese, E., Lall, S., Bhowmik, A., & Rai, A. (2016). Identification of Differentially Expressed Genes in RNA-seq Data of Arabidopsis thaliana: A Compound Distribution Approach. Journal of Computational Biology, 23(4), 239–247. https://doi.org/10.1089/cmb.2015.0205
- Bäckström, D., Domellöf, M. E., Granåsen, G., Linder, J., Mayans, S., Elgh, E., Mo, S. J., & Forsgren, L. (2017). PITX3 genotype and risk of dementia in Parkinson’s disease: A population-based study. Journal of the Neurological Sciences, 381, 278–284. https://doi.org/10.1016/j.jns.2017.08.3259
- Barrett, T. “NCBI GEO: Mining Millions of Expression Profiles–Database and Tools.” Nucleic Acids Research, 2004, pp. D562–D566. https://doi.org/10.1093/nar/gki022.
- Barrett, T., Wilhite, S. E., Ledoux, P., Evangelista, C., Kim, I. F., Tomashevsky, M., Marshall, K. A., Phillippy, K. H., Sherman, P. M., Holko, M., Yefanov, A., Lee, H., Zhang, N., Robertson, C. L., Serova, N., Davis, S., & Soboleva, A. (2012). NCBI GEO: archive for functional genomics data sets—update. Nucleic Acids Research, https://doi.org/10.1093/nar/gks1193
- Clarke, C. E. “Parkinson’s Disease.” BMJ, 2007, pp. 441–45. https://doi.org/10.1136/bmj.39289.437454.ad.
- Corti, O., et al. “Inflammation and Regulatory T Cell Genes Are Differentially Expressed in Peripheral Blood Mononuclear Cells of Parkinson’s Disease Patients.” Scientific Reports, 2021. https://doi.org/10.1038/s41598-021-81961-7.
- Diao, H., Li, X., Hu, S., & Liu, Y. (2012). Gene Expression Profiling Combined with Bioinformatics Analysis Identify Biomarkers for Parkinson Disease. PloS One, 7(12), e52319. https://doi.org/10.1371/journal.pone.0052319
- Diekelmann, S., et al. “What Genetics Tells Us About the Causes and Mechanisms of Parkinson’s Disease.” Physiological Reviews, 2010, pp. 1075-1112. https://doi.org/10.1152/physrev.00022.2010.
- Fanning, S., et al. “Parkinson’s Disease: Proteinopathy or Lipidopathy.” npj Parkinson’s Disease, 2019. https://doi.org/10.1038/s41531-019-0103-7
- Feldman, J., et al. Cognitive Neuroscience: LRRK2 Parkinson Disease. 2nd ed., W.W. Norton, 2023. https://www.ncbi.nlm.nih.gov/books/NBK1208/
- Gasser, T. (2009). Molecular pathogenesis of Parkinson disease: insights from genetic studies. Expert Reviews in Molecular Medicine. https://doi.org/10.1017/s1462399409001148
- Gene Ontology Consortium. “Gene Ontology Consortium: Going Forward.” Nucleic Acids Research, 2015. https://doi.org/10.1093/nar/gku1179.
- Gene Ontology overview. (2024, July 24). Gene Ontology Resource. https://geneontology.org/docs/ontology-documentation/
- Geo. (n.d.-a). About GEO2R – GEO – NCBI. https://www.ncbi.nlm.nih.gov/geo/info/geo2r.html
- GEO. (n.d.-b). Home – GEO – NCBI. https://www.ncbi.nlm.nih.gov/geo/
- Habak, C., et al. (2014). Dopamine transporter SLC6A3 genotype affects cortico-striatal activity of set-shifts in Parkinson’s disease. Brain. doi: 10.1093/brain/awu251
- Jiménez-Jiménez, F. J., et al. (2013). PITX3 and Risk for Parkinson’s Disease: A Systematic Review and Meta-Analysis. European Neurology, 71(1–2), 49–56. doi: 10.1159/000353981
- Kalbfleisch, T., et al. (2010). Genomics, bioinformatics, and computational biology. In Elsevier eBooks. doi: 10.1016/b978-0-08-046884-6.00236-0
- Kanehisa, M. (2000). KEGG: Kyoto Encyclopedia of Genes and Genomes. Nucleic Acids Research. doi: 10.1093/nar/28.1.27
- Kanehisa, M., et al. “KEGG: New Perspectives on Genomes, Pathways, Diseases and Drugs.” Nucleic Acids Research, 2017. https://doi.org/10.1093/nar/gkw1092.
- KEGG Database. (n.d.). https://www.genome.jp/kegg/kegg1.html
- Khan, A. U., et al. “Awareness and Current Knowledge of Parkinson’s Disease: A Neurodegenerative Disorder.” International Journal of Neuroscience, 2018. https://doi.org/10.1080/00207454.2018.1486837.
- Klockgether, T. “Parkinson’s Disease: Clinical Aspects.” Cell and Tissue Research, 2004, pp. 115–120. https://doi.org/10.1007/s00441-004-0975-6.
- Kowal, S. L., et al. “The Current and Projected Economic Burden of Parkinson’s Disease in the United States.” Movement Disorders, 2013, pp. 311–318. https://doi.org/10.1002/mds.25292.
- Marras, C., et al. “Prevalence of Parkinson’s Disease across North America.” npj Parkinson’s Disease, 2018. https://doi.org/10.1038/s41531-018-0058-0
- Nussbaum, R. L., & Ellis, C. E. “Alzheimer’s Disease and Parkinson’s Disease.” New England Journal of Medicine, 2003, pp. 1356–64. https://doi.org/10.1056/nejm2003ra020003.
- Opara, J. A., et al. “Quality of Life in Parkinson`s Disease.” Journal of Medicine and Life, 2012, pp. 375–381. www.ncbi.nlm.nih.gov/pmc/articles/PMC3539848/.
- Pang, S. Y., et al. “The interplay of aging, genetics and environmental factors in the pathogenesis of Parkinson’s disease.” Translational Neurodegeneration, 2019. https://doi.org/10.1186/s40035-019-0165-9
- Rajalahti, T., et al. “Discriminating Variable Test and Selectivity Ratio Plot: Quantitative Tools for Interpretation and Variable (Biomarker) Selection in Complex Spectral or Chromatographic Profiles.” Analytical Chemistry, 2009, pp. 2581–2590. https://doi.org/10.1021/ac802514y.
- Reith, M. E. A., et al. “The dopamine transporter gene SLC6A3: multidisease risks.” Molecular Psychiatry, 2021. https://doi.org/10.1038/s41380-021-01341-5
- Solano, L. E., et al. “PRRGO: a tool for visualizing and mapping globally expressed genes in public gene expression omnibus RNA-Sequencing studies to PageRank-scored gene ontology terms.” bioRxiv (Cold Spring Harbor Laboratory), 2024. https://doi.org/10.1101/2024.01.21.576540
- SRplot – Science and Research online plot. (n.d.). https://www.bioinformatics.com.cn/srplot
- Snyder, H. R. “Understanding Neurodegenerative Diseases.” Nature Reviews Neuroscience, 2022, pp. 124–136. https://doi.org/10.1038/s41583-022-00500-1.
- Takeda, A., et al. “Bioinformatics tools and Parkinson’s Disease.” Bioinformatics, 2020. https://doi.org/10.1093/bioinformatics/btz892.
- Van Lieshout, K., et al. “Genetic Etiology of Parkinson’s Disease and Parkinsonism: The Emerging Role of VPS35.” Annual Review of Neuroscience, 2018. https://doi.org/10.1146/annurev-neuro-080317-061930.
- Vos, T., et al. “Global, Regional, and National Burden of 369 Diseases and Injuries for 204 Countries and Territories, 1990–2019: A Systematic Analysis for the Global Burden of Disease Study 2019.” The Lancet, 2020. https://doi.org/10.1016/s0140-6736(20)30925-9.
- Wang, Y., et al. “Integrating Bioinformatics Analysis and Experimental Validation to Identify Biomarkers of Parkinson’s Disease.” Experimental and Therapeutic Medicine, 2020. https://doi.org/10.3892/etm.2020.8775.
- Zhao, J., et al. “The Role of LRRK2 in Parkinson’s Disease Pathogenesis.” Molecular Neurodegeneration, 2020. https://doi.org/10.1186/s13024-020-00394-w.
- Zhou, Q. “Investigating Pathological Pathways in Parkinson’s Disease through Single-Cell Transcriptomics.” Neuroscience Letters, 2022. https://doi.org/10.1016/j.neulet.2022.136923.
- Zhu, L., et al. “The Link between Neuroinflammation and Parkinson’s Disease: What the Latest Research Shows.” Journal of Neurochemistry, 2024. https://doi.org/10.1111/jnc.15898.

