Using Bioinformatics to Investigate Differences in Regulation of Leukocyte Gene Activity Between Schizophrenic and Neurotypical Populations

ABSTRACT
Background
Schizophrenia is a psycho-somatic disease that occurs to both men and women at different ages. It does not have a cure yet, but there are certain antipsychotics and other neurological medications that control symptoms. This disease occurs due to a combination of both environmental and genetic factors.This disease causes individuals to have hallucinations, paranoia, disorganized speech or thoughts, and sometimes act irrationally. Due to these symptoms, patients with this condition tend to be isolated. There is no certain cause for this disease. It is a composite of genetic factors and environmental factors, but the specifics of each have not been discovered yet.
Purpose
Therefore, the goal of this research study is to determine the effect of the expression of significant genes in patients with schizophrenia and their potential functions and biological pathway to potentially identify genetic biomarkers for potential medications targeting specific gene regulation.
Methods
To conduct this study, several bioinformatics tools and databases were used including NCBI, GEO2R, SRplot, GO enrichment analysis and KEGG enrichment analysis. Specifically, the GEO Dataset used to find the DEGs (differentially expressed genes was the accession number GSE263180. To categorize the samples within GEO2R, 2 groups were defined. One was the control population, which didn’t have schizophrenia, and the other population, which did have schizophrenia. Finally, SRplot was used to conduct GO and KEGG pathway analyses to determine the potential functions and biological pathways these genes are associated with.
Results
The bioinformatic tools that generated these results utilized the R programming language, which was pre-programmed by artificial intelligence and machine learning algorithms. The script used to formulate these results is linked here R Script for GEO2R Sahaana . Top 30 DEGs were identified based on fold change and p value. 15 of those genes were upregulated and 15 were downregulated. Down and up regulated DEGs. The top GO terms that were enriched in our results included mitochondrial electron transport from NADH to ubiquinone, NADH Dehydrogenase Complex Assembly, mitochondrial respiratory chain complex 1 assembly, and mitochondrial ATP synthesis coupled electron transport. The gene ND6 was also enriched and significant. The top KEGG pathways that were enriched in our results included RNA5-8SN3, ND6, oxidative phosphorylation, and retrograde endocannabinoid signaling. The gene functions mitochondrial electron transport from NADH to ubiquinone and NADH Dehydrogenase Complex Assembly, alongside the genes ND6 and RNA5-8SN3 are the main functions and biological pathways in the studied DEGs.
Discussion
In summary, this study found that the ND6 gene and RNA5-8SN3 pathway are connected to schizophrenia through mitochondrial dysfunction and increased rRNA gene count in cells of patients suffering from schizophrenia. Our study results can support researchers to determine the significance of the relationship between significant gene functions/pathways and schizophrenia in order to develop more accurate medications for schizophrenics.
INTRODUCTION
Schizophrenia is a mental and neurological disorder that can be genetically inherited, but can also be caused by environmental factors (Trifu et al., 2020). Men and women are marginally inequally at risk for this disease (SAMHSA, 2023). Schizophrenia causes hallucinations, paranoia, and disorganized speech or thoughts (Patel et al., 2014). Schizophrenic people are not generally violent, but rather take on the role of a victim more often. People with this disorder struggle to communicate to others, and justify their hallucinations. They can be very isolated and afraid, since their perspective of the world is not shared by anyone else (SAMHSA, 2023). The role that genes play in schizophrenia is not heavily researched, schizophrenia itself is not a well-researched subject (Trifu et al., 2020). The goal of this study was to use statistical analysis of a GEO2R dataset (Accession number: GSE263180) to find the genetically significant differences in the presence and expression of genes in blood leukocytes of schizophrenic participants and unaffected study participants.
Leukocytes in particular were important for this study, as compared to red blood cells (RBCs) or neurons, due to their ability to do many things other cells cannot do, like entering the cerebrospinal fluid (CSF) at its formation site, or enter capillaries located in the surface of the brain (Wang et al., 2024). It was important for us to discover the relevance of specific leukocyte genes to schizophrenia.
Bioinformatic tools such as Genome-Wide Association Studies (GWAS) and pathway analysis using GO and KEGG are used in bioinformatics studies in order to further deepen the genetic understanding behind schizophrenia (Wahbeh et al., 2024).
The genes known to play a part in schizophrenia are regulated by other genes, which have not been heavily investigated into as the direct genes that take part in affected participants exhibiting certain symptoms (Wahbeh et al., 2024). For schizophrenic mothers, studies about the effects on the fetus are between far and few, especially exploring chronic health conditions the fetus and children may experience past the neonatal stage (Vigod et al., 2022).
The goal of this study is to observe the significance and differences in down and upregulated genes between people with schizophrenia and the control population. This study’s hypothesis, in terms of gene expression, is that DEGs like NADH dehydrogenase activity will present differently in people with schizophrenia compared to the control population
This study was performed to recognize the relevance of these top 30 DEGs in schizophrenic patients to urge pharmaceutical therapeutic efforts to pursue medications targeting specific gene regulation. Schizophrenia is also a very unexplored field compared to other diseases, such as Alzheimer’s Disease and Parkinson’s, so the addition of more research into this field is very important to come closer to better medication and therapies for affected populations (Winship IR et al., 2019).
METHODS
NCBI and Primary Research
The different bioinformatics tools and databases used in this study are summarized in Figure 1. This study used NCBI to search for a schizophrenia dataset. Once the search was set to “GEO Datasets”, a search was conducted on the best dataset revolving around schizophrenia. The dataset used in this study is called “Identification of Differential Expression Genes of Blood Leukocytes for Schizophrenia,” The primary research that produced this dataset consisted of peripheral blood leukocyte samples of 9 schizophrenic patients and 20 healthy patients. Then, those samples would be taken for RNA sequencing analysis. The bioinformatic analyses used in this primary research included differentially expressed gene analysis, pathway enrichment analysis, and weighted gene co-expression network analysis.
GEO2R Analysis
The data from this primary research was then separated into two groups called “C-group,” the control group, and “T-group,” the schizophrenic group. Then, the data was visualized using the “Analyze by GEO2R” setting on the NCBI database.
SRplot Analysis
The individual results were then uploaded into a Google Sheet, where using the fold change and p value columns, the top 15 most upregulated and most downregulated genes were determined. Using the 30 DEGs, all of their symbols were uploaded into SRplot, where they were analyzed and produced both results of KEGG and GO analyses.
GO and KEGG analyses
The function of the DEGs in this dataset are revealed through the GO analysis, which shows genes with functions such as mitochondrial electron transport from NADH to ubiquinone and NADH dehydrogenase complex assembly. Some biological pathways that these DEGs are involved in are retrograde endocannabinoid signaling and oxidative phosphorylation.
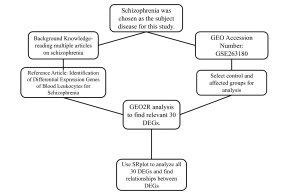
Figure 1. Summary of the methods and bioinformatics tools and databases used in this study
RESULTS
GEO2R Results
In this study, 30 DEGs were identified based on fold change and p values. There were 15 upregulated and 15 downregulated genes included in GEO2R analysis data top DEGs. Using SRplot, visualizations of this study’s results were able to be produced, through which- under the assumption enrichment scores above 3 are considered enriched- mitochondrial transport of NADH to ubiquinone, NADH dehydrogenase complex assembly, mitochondrial respiratory chain complex 1 assembly, NADH dehydrogenase ubiquinone activity, and NADH dehydrogenase quinone activity were considered enriched DEGs.
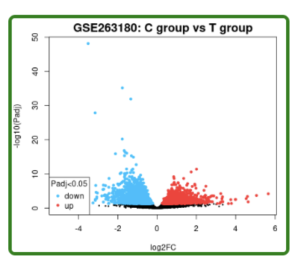
Figure 2. Volcano Plot. This volcano plot shows 3717 differentially expressed genes (DEGs) as each dot, both red and blue. The C-group is controlled (unaffected by schizophrenia), and the T-group represents schizophrenic people. Red dots represent upregulated genes, and blue dots represent downregulated genes.
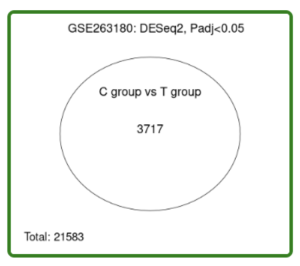
Figure 3. Venn Diagram. 3717 genes are differentially expressed (all the dots in volcano plot) out of a total 21583 total genes in the dataset.
GO Analysis Results
Using the top 30 DEGs from GEO2R analysis results, a GO analysis was performed through the server SRplot in order to obtain relevant gene functions and pathways that affect the genetic aspect of schizophrenia. The results were split into ontologies, and ranked on an enrichment score. The cellular component (CC) and molecular function (MF) ontologies ranked highest on the enrichment score scale, and hence, the gene functions within the CC and MF ontologies were focused on in more depth throughout the rest of this study. Gene functions were also separated by significance using a color-based scale, further allowing the scope of this investigation to become more focused.
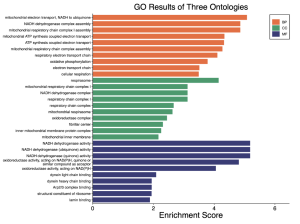
Figure 4. GO results of three ontologies. This figure displays the GO results of all three ontologies- biological processes (BP), cellular component (CC), and molecular function (MF). The most enriched ontology based on the GEO2R dataset is BP, followed by MF, and lastly with CC. Enrichment scores ranged from 0 to 5.
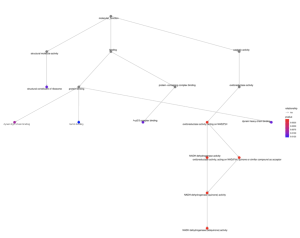
Figure 5. MF GO Plot. This plot displays the connections between BP, CC, and MF results, signified by dots connected by lines. The bottom right corner contains connections between significant results, as they are red. The more red the dot is, the more significant the result is.
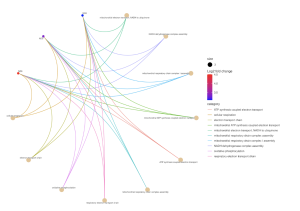
Figure 6. BP CNET plot. This plot displays the types of connections between gene functions and BP results. The most significant gene is ND6 due to its increased Log2 fold change value, and it has connections drawn to every BP result.
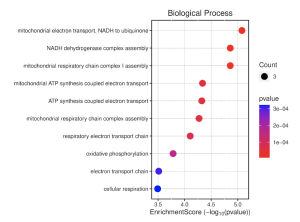
Figure 7. BP Enrichment Score Dot Plot. This plot shows the most relevant BP gene functions using a combination of the enrichment score and p-value. The top three functions are highest on the enrichment score scale, and are the most red, which makes them the most enriched and significant of the BP results.
KEGG Pathway Results
Similar to GO analysis, KEGG pathway analysis was also run in the SRplot server. It revealed the most significant and relevant gene pathways that affect schizophrenia. Associated diseases and disorders were also portrayed in these results, connecting to relevant DEGs, therefore allowing for inter-disease connections to be explored. Connecting both GO and KEGG analyses, certain parts of these results explored how gene functions and pathways in both analyses are connected in a multi-faceted network.
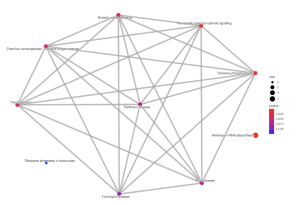
Figure 8. Pathway EMAP Plot. This plot displays the connections between the shown diseases associated with schizophrenia, separated by p-value to display the significance. The size of the dots relate to gene count enriched in a given pathway. The color of the dots reveal the significance of the pathway enrichment.
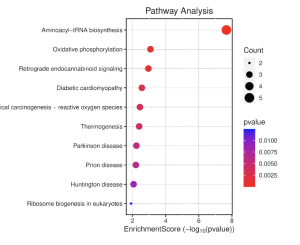
Figure 9. Pathway Enrichment Score Dot Plot. This plot displays the enrichment scores of different diseases related to schizophrenia in the KEGG pathway analysis. The top three pathway results have the greatest significance, though as seen through Figure 8, Aminoacyl-tRNA biosynthesis is disconnected from all other diseases.
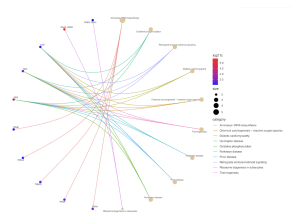
Figure 10. Pathway CNET Plot. This plot shows how gene functions and pathways in GO and KEGG analyses are connected in a network. This plot displays 10 genes that are connected to KEGG pathway analysis results. It shows how gene functions and pathways within GO terms or KEGG pathways are connected through a network. The connections are displayed through the multi-colored curved lines. Aminoacyl tRNA biosynthesis and Parkinson’s Disease have the largest dots, showing their increased significance compared to the other diseases. The color of the dots display their significance. The higher the log2 fc value, or the more red the dot is, the more significant it is.
Table 1. Summary of Results
GO Results | KEGG Results | Common Results |
ND6 | Oxidative phosphorylation | ND6 |
Retrograde endocannabinoid signaling | ||
Aminoacyl t-RNA biosynthesis (disconnected from all other gene functions) | ||
ND6 | ||
RNA5-8SN3 |
Supplementary Materials
R Script: R Script for GEO2R Sahaana
Top DEGs: GEO2R analysis data of top DEGs
DISCUSSION
The goal of this study, as mentioned prior, was to observe the differences in significant DEGs between people with and without schizophrenia. Out of the many gene functions presented in the results of this study, mitochondrial electron transport from NADH to ubiquinone and NADH dehydrogenase complex assembly through the gene ND6 presented as most significant, due to their low associated p-value, high log2fc values, and high enrichment scores. DEGs mainly participated in pathways such as RNA5-8SN3, ND6, oxidative phosphorylation, retrograde endocannabinoid signaling, and aminoacyl t-RNA biosynthesis pathways, as they were revealed to be the most significant due to their low p-values and high log2fc values.
ND6 Gene
The ND6 gene is located in the inner mitochondrial membrane of a cell, and is known to play a role in diseases such as Leber hereditary optic neuropathy, spinal muscular atrophy with lower extremity predominante 2B, and Leigh disease. The gene itself is responsible for enabling NADH dehydrogenase (ubiquinone) activity, mitochondrial respiratory chain complex I assembly, and mitochondrial electron transport (NCBI). Hence, these gene functions were seen as significant in the results of our GO analysis. In the past, researchers have determined that schizophrenia is linked with mitochondrial dysfunction, specifically describing ND6 as one of many genes that function differently in patients with schizophrenia compared to an unaffected population (Verge et al., 2011). But, no study known to us has explored the relationship between leukocytic ND6 and schizophrenia.
RNA5-8SN3 Pathway
Based on the pathway CNET plot results, the main significant pathway, RNA5-8SN3, is only associated with ribosome biogenesis in eukaryotes. In the past, studies have shown that the gene group that RNA5-8SN3 is in, 5.8S ribosomal RNA, is associated with ribosome biogenesis through nucleolar protein 53 (Nop53). Nop53 is a factor for ribosome biogenesis to occur, and is also required for maturation of 5.8S to occur (Micol-Ponce et al., 2020). No prior research, to our knowledge, has associated 5.8S rRNA with schizophrenia, but rRNA gene count has been shown to be increased in people with schizophrenia compared to a healthy control sample (Chestkov et al., 2018).
Oxidative Phosphorylation
RNA5-8SN3 has not been linked to oxidative phosphorylation in prior studies known to us. Although, oxidative phosphorylation has been linked to schizophrenia through the oxidative phosphorylation system (OXPHOS) deficiencies (Bergman et al., 2016). Scientists have revealed that OXPHOS deficiencies are commonly seen in patients with disorders that may cause psychosis symptoms, like schizophrenia. The inverse relationship has also been proven- patients with OXPHOS deficiencies can exhibit symptoms of psychosis (Bergman et al., 2016).
Retrograde Endocannabinoid Signaling
RNA5-8SN3 has also not been linked to retrograde endocannabinoid signaling in prior studies known to us. Endocannibinoids (ECB), however, are linked to schizophrenia (Desfossés et al., 2010). To discuss what this signaling gene function is, it is essential to understand the meaning of “endocannabinoid”. This word refers to neurotransmitters in the body that structurally represent compounds in cannabis (Grinspoon, 2021). ECBs have been proven to increase symptoms of schizophrenia due to their active role in the parts of the human brain that are disturbed by schizophrenia disorder (Desfossés et al., 2010). Endocannabinoid signaling in general (not retrograde), is associated with schizophrenia due to its association with regulating dopamine (Covey et al., 2017). This association is relevant due to the relationship between the symptoms of schizophrenia and dopamine. An excess or underproduction of dopamine has increased effects of different schizophrenia symptoms (Davis et al., 1991).
The significance of this study’s results is presented by adding more information to a small collection of schizophrenia genetic research. Also, the knowledge of RNA5-8SN3 pathway’s relationship with schizophrenia can support further research into the disorder and possibly produce positive results supporting treatment plans for schizophrenia. In relevance to this study in particular, due to our use of bioinformatic datasets as a result of microarray experiments facilitated by other scientists, a limitation this study faces is our identified genes having to be further studied in a lab or clinical environment first before beginning the process of developing a vaccine or any other therapeutic medication. The 30 DEGs identified in this study can be further investigated and tested by researchers in a laboratory or clinical trial to determine the significance of the relationship between the RNA5-8SN3 and ND6 gene functions/pathways and schizophrenia in order to develop more accurate medications for schizophrenics that have less debilitating side effects.
Conclusion
The goal of this study was to observe the differences in the presence and expression of down and upregulated genes in between people with schizophrenia and a healthy population using a variety of bioinformatic tools like GEO2R and SRplot. This study’s hypothesis predicted that DEGs, like NADH dehydrogenase activity, will present differently in people with schizophrenia compared to the healthy population. This hypothesis was proven to be true through the results of this study. This study found that the ND6 gene and RNA5-8SN3 pathway are connected to schizophrenia through mitochondrial dysfunction and increased rRNA gene count in cells of patients suffering from schizophrenia. Using this study’s findings, further research can be facilitated on the significance of schizophrenia in relation to the RNA5-8SN3 and ND6 gene pathway’s relationship in order to develop medications that more accurately target symptoms of schizophrenia to permit affected populations to have the best quality of life possible.
References
- Adamu, M. J., et al. (2023). Unraveling the pathophysiology of schizophrenia: Insights from structural magnetic resonance imaging studies. Frontiers in Psychiatry. https://www.frontiersin.org/articles/10.3389/fpsyt.2023.1188603/full
- Bergman, O., & Ben-Shachar, D. (2016). Mitochondrial oxidative phosphorylation system (OXPHOS) deficits in schizophrenia: Possible interactions with cellular processes. Canadian Journal of Psychiatry, 61(8), 457-469. https://doi.org/10.1177/0706743716648290
- Chestkov, I. V., et al. (2018). Abundance of ribosomal RNA gene copies in the genomes of schizophrenia patients. Schizophrenia Research. https://www.sciencedirect.com/science/article/abs/pii/S092099641830001X
- Covey, D. P., et al. (2017). Endocannabinoid modulation of dopamine neurotransmission. Neuropharmacology, 124, 52-61.
- Davis, K. L., et al. (1991). Dopamine in schizophrenia: A review and reconceptualization. The American Journal of Psychiatry, 148(11), 1474-1486.
- Desfossés, J., et al. (2010). Endocannabinoids and schizophrenia. Pharmaceuticals, 3(10), 3101-3126. https://doi.org/10.3390/ph3103101
- Frota, I. J., et al. (2023). Decrease in cognitive performance and increase of the neutrophil-to-lymphocyte and platelet-to-lymphocyte ratios with higher doses of antipsychotics in women with schizophrenia: A cross-sectional study. BMC Psychiatry, 23(1), 558. https://doi.org/10.1186/s12888-023-05050-x
- GEO2R. (n.d.). NCBI. https://www.ncbi.nlm.nih.gov/geo/info/geo2r.html
- Grinspoon, P. (2021). The endocannabinoid system: Essential and mysterious. Harvard Health. https://www.health.harvard.edu/blog/the-endocannabinoid-system-essential-and-mysterious-202108112569
- Havdahl, A., et al. (2022). Associations between pregnancy-related predisposing factors for offspring neurodevelopmental conditions and parental genetic liability to attention-deficit/hyperactivity disorder, autism, and schizophrenia: The Norwegian Mother, Father and Child Cohort Study (MoBa). JAMA Psychiatry, 79(8), 799-810. https://doi.org/10.1001/jamapsychiatry.2022.1728
- Micol-Ponce, R., et al. (2020). SMALL ORGAN4 is a ribosome biogenesis factor involved in 5.8S ribosomal RNA maturation. Plant Physiology, 184(4), 2022-2039. https://doi.org/10.1104/pp.19.01540
- MT-ND6 mitochondrially encoded NADH dehydrogenase 6 [Homo sapiens (human)] – Gene – NCBI. (n.d.). National Center for Biotechnology Information. https://www.ncbi.nlm.nih.gov/gene/4541
- Patel, K. R., et al. (2014). Schizophrenia: Overview and treatment options. P & T: A Peer-Reviewed Journal for Formulary Management, 39(9), 638-645.
- Schizophrenia. (n.d.). SAMHSA. https://www.samhsa.gov/mental-health/schizophrenia
- Seeman, M. V. (2018). Women who suffer from schizophrenia: Critical issues. World Journal of Psychiatry, 8(5), 125-136. https://doi.org/10.5498/wjp.v8.i5.125
- Simoila, L., et al. (2020). Schizophrenia and pregnancy: A national register-based follow-up study among Finnish women born between 1965 and 1980. Archives of Women’s Mental Health, 23(1), 91-100. https://doi.org/10.1007/s00737-019-0948-0
- Tang, D., et al. (2023). SRplot: A free online platform for data visualization and graphing. PLOS ONE, 18(11), e0294236. https://doi.org/10.1371/journal.pone.0294236
- Trifu, S. C., et al. (2020). Genetics of schizophrenia (review). Experimental and Therapeutic Medicine, 20(4), 3462-3468. https://doi.org/10.3892/etm.2020.8973
- Verge, B., et al. (2011). Mitochondrial DNA (mtDNA) and schizophrenia. European Psychiatry, 26(1), 45-56.
- Vigod, S. N., et al. (2022). Maternal schizophrenia and the risk of a childhood chronic condition. Schizophrenia Bulletin, 48(6), 1252-1262. https://doi.org/10.1093/schbul/sbac091
- Wahbeh, M. H., et al. (2024). A functional schizophrenia-associated genetic variant near the TSNARE1 and ADGRB1 genes. HGG Advances, 5(3), 100303. https://doi.org/10.1016/j.xhgg.2024.100303
- Wang, F., et al. (2024). Identification of differentially expressed genes of blood leukocytes for schizophrenia. Frontiers in Genetics. https://www.frontiersin.org/articles/10.3389/fgene.2024.1398240/full
- What is schizophrenia? (n.d.). Psychiatry.org. https://psychiatry.org/patients-families/schizophrenia/what-is-schizophrenia
- Winship, I. R., et al. (2019). An overview of animal models related to schizophrenia. Canadian Journal of Psychiatry, 64(1), 5-17. https://doi.org/10.1177/0706743718773728

