Exploring Genetic Mechanisms of Type 2 Diabetes Using Bioinformatics Tools and Databases

ABSTRACT
Background
Type 2 diabetes occurs when the body can not properly use insulin. This causes high blood glucose levels, which can further lead to serious side effects like kidney failure, neuropathy, and cardiovascular disease. Although there are multiple genes found to be linked to Type 2 diabetes, it is still unknown how exactly these genes contribute to the condition. Thus, to create more treatments, it is crucial to comprehend the precise genetic changes and pathways associated with Type 2 diabetes. The main objectives of this research are finding differentially expressed genes (DEGs) linked to Type 2 diabetes and understanding the pathways these genes affect.
Methods
To conduct this research, various bioinformatics tools and databases were used. First a dataset for a study on type 2 diabetes was found using the NCBI GEO2R bioinformatics Database. GSE271700 was the dataset found to match the disease. In the dataset, the samples were divided into two groups: diabetic and non-diabetic. GEO2R analysis was conducted to identify the genes that were expressed differently between diabetic and non-diabetic samples. The resulting differentially expressed genes were then refined using statistics by using the highest and lowest 15 LogFc values, to get the upregulated and down regulated genes. Finally for the functional annotation and pathway analysis of the DEGs, we used the ShinyGo bioinformatics tool.
Results
The study of the type 2 diabetes dataset identified 512 DEGs, with 273 upregulated and 239 downregulated genes, which got narrowed down to 30 total genes. From this dataset genes such as EPHA4, COL11A2, KITLG, EPHA2, and FLT1, were the top expressed genes found using KEGG. Furthermore, Gene Ontology (GO) enrichment analysis using ShinyGo showed enriched biological processes such as regulation of cell proliferation, response to insulin stimulus, and glucose homeostasis. Meanwhile, KEGG pathway analysis identified key pathways including the hematopoietic cell lineage, phospholipase D signaling, and insulin signaling pathways. All of these findings provide insights into the complex mechanisms underlying Type 2 diabetes.
Conclusion
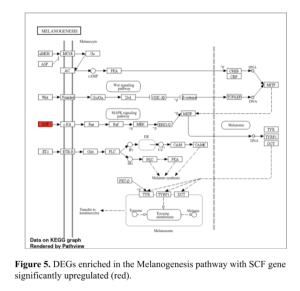
To summarize, the results identified were DEGs between healthy and unhealthy samples. The top DEGs were highly enriched or associated with biological pathways. The Melanogenesis pathway with SCF gene significantly upregulated (red). The RAS signaling pathway with OF gene significantly upregulated (red). Finally the RAPI Signaling pathway with OF gene significantly upregulated (red). These specific genes and pathways involved can be studied further in the lab to help better understand the complexity of the disease and potential cures.
KEYWORDS: Type 2 diabetes, Bioinformatics, NCBI GEO2R, ShinyGo, Gene Ontology, KEGG
INTRODUCTION
Type 2 diabetes is a disease where the body can not use insulin properly (Helmholtz Association of German Research Centres, 2024). This is a big health problem that affects many people and can cause other serious issues like heart disease and nerve damage (Helmholtz Association of German Research Centres, 2024). My research aims to find out how changes in gene activity related to type 2 diabetes, so we can find new ways to treat diabetes. The question this research study is asking is, what changes in gene activity occur in people with type 2 diabetes, and how can these changes help us find new treatments?
Since the body can no longer produce enough insulin due to resistance, Type 2 diabetes causes additional health issues and affects a large number of people (Grandl et al., 2024). Although certain genes have been connected to type 2 diabetes (Dayeh et al., 2014; Kang et al., 2024), the exact way in which these genes cause the illness is still unknown (Gottlieb & Dyer, 2020).
So far what is known is that Type 2 diabetes is caused by insulin resistance and problems with insulin production (Xue et al., 2023). It affects the body’s ability to manage blood sugar and can lead to serious health issues (Dye & Maunakea, 2024).
Studies have shown that certain pathways related to insulin and glucose metabolism are disrupted in type 2 diabetes (Lloyd et al., 2023; Kang et al., 2024). But, the specific genetic factors that lead to diabetes are unknown (Gottlieb & Dyer, 2020).
The main goal of this study is to find different genes that when expressed are correlated with Type 2 Diabetes. The genes associated with diabetes, found from this study, could help manage type 2 diabetes.
METHODS
Data Collection
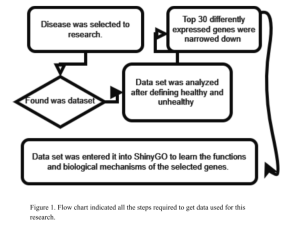
To conduct this research, various bioinformatics tools were employed to analyze and interpret the data effectively (Figure 1). Initially, a suitable dataset for the study on type 2 diabetes was identified using the NCBI GEO2R bioinformatics database (About GEO2R – GEO, 2024). The dataset, identified as GSE271700, contained comprehensive data relevant to the disease. In this dataset, the samples were categorized into two groups: diabetic and non-diabetic, allowing for a comparative analysis.
Identification of Genes Expressed Differently between Diabetic and Non- Diabetic Sample
The first step involved using the GEO2R bioinformatics analysis tool to determine which genes were differentially expressed (DEGs) between the diabetic and non-diabetic samples. This bioinformatics tool facilitated the identification of genes with significant differences in expression levels. DEGs areDifferentially expressed genes are genes that show statistically significant differences in expression levels between two or more conditions, such as between diabetic and non-diabetic samples (NCBI, 2015; Bioinformatics, 2019).
Following the identification of differentially expressed genes (DEGs), statistical methods were applied to refine the results into top 50 DEGs. Specifically, the highest and lowest 15 LogFc (log fold change) values were selected to pinpoint the most significantly upregulated and downregulated genes. This step was crucial for focusing on the genes with the most pronounced changes in expression, which are often the most biologically relevant.
Determining which functions and biological pathways the top DEGs are mostly associated with
Finally, to determine potential key biological functions and biological pathways enriched in the top DEGs, ShinyGo bioinformatics tool was used for functional annotation and pathway analysis of the DEGs. ShinyGo provides an interactive platform for understanding the biological significance of gene sets by linking them to known biological pathways and functions (ShinyGo, 2024). This tool helped elucidate the potential roles of the DEGs in the pathogenesis of type 2 diabetes, thereby offering potential insights into the underlying molecular mechanisms of the disease.
RESULTS
Identification of Genes Expressed Differently between Diabetic and Non-diabetic sample Using GEO2R Analysis
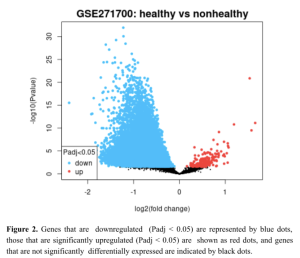
GEO2R bioinformatics tool, an interphase between NCBI and GEO was used to identify differentially expressed genes (DEGs.). GEO2R uses R programming language to generate DEG results (R-Script of this research). The GEO2R analysis revealed several genes that are expressed differently between the healthy (non-diabetic) and non-healthy (diabetic) samples as shown in Figure 2. The volcano plot (Figure 2) reveals significant differences in gene expression, with the x-axis representing log2 or fold change and the y-axis displaying -log10 or P Value. Some genes were significantly upregulated (red dots) and others downregulated (blue dots) with Padj < 0.05. These results show differences in gene expression between the healthy and unhealthy samples.
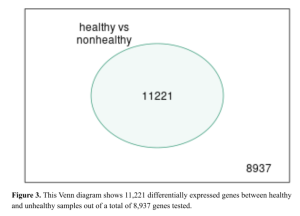
Next, the Venn diagram result (Figure 3) reveals that out of the total number of genes analyzed, 11,221 genes were significantly differentially expressed between healthy and unhealthy (Figure 3). Further, these genes were narrowed down to top 30 DEGs (Supplementary Results: Top 30 DEGs)
Functional and Enrichment Analysis Using ShinyGo Bioinformatics Tool
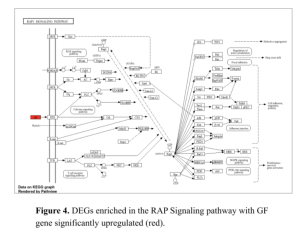
In this study the gene pathways associated with diabetes were found using differential expression gene (DEG) analysis. The Pathway of Melanogenesis (Figure 4) illustrates the intricate signaling mechanisms involved, highlighting key components such as α-MSH, MC1R, and MITF. This pathway is crucial not only for understanding melanogenesis but also for identifying potential overlaps with diabetic gene expression patterns.
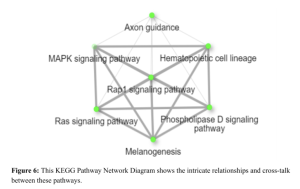
Additionally, a network diagram of Gene Pathway Interactions (Figure 5) showcases the complex interconnections between various pathways, including the MAPK signaling pathway, Ras signaling pathway, and Phospholipase D signaling pathway. These interactions underscore the multifaceted nature of gene regulation in diabetes.
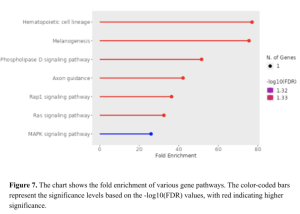
The Pathway Enrichment Analysis (Figure 6) provides assessment of different pathways in our dataset. Hematopoietic cell lineage, Melanogenesis, and Phospholipase D signaling pathway exhibit high fold enrichment, indicating their potential roles in the disease mechanism. The MAPK signaling pathway, though showing a lower fold enrichment, is still significant,
suggesting its involvement in diabetes (Figure 7). These representations collectively show the complexity of gene interactions. These genes identified could be potentially studied in a more in depth study.
Supplementary Materials
R Script: R-Script of this research
Top DEGs: Top 30 DEGs
DISCUSSION
This study’s main goal was to use bioinformatics to first identify differentially expressed genes (DEG) in diabetic samples and to investigate the potential gene functions and pathways linked to diabetes. Our research revealed that indeed some genes are expressed differently between diabetic and nondiabetic samples (Figure 2).
Further, functional and enrichment analysis using Shiny Go showed enrichment of pathways namely the Insulin Secretion Pathway, Glucagon Signaling Pathway, and AGE-RAGE Signaling Pathway in Diabetic Complications as significantly upregulated in diabetic samples. The SFC gene is part of the sarcoglycan complex, crucial for muscle integrity, and its dysfunction can affect muscle metabolism, influencing glucose metabolism and insulin sensitivity (Reference needed). Growth factors like insulin-like GF play essential roles in cell growth, differentiation, and survival, with dysregulation contributing to insulin resistance and diabetes (Kahn, 1994; McDonald & Yateman, 1999). RTKs, which are cell surface receptors for various growth factors, cytokines, and hormones, are vital for maintaining normal metabolic processes, and their dysregulation, especially in the insulin receptor, is a key mechanism in the development of type 2 diabetes (Schlessinger, 2000; White, 1998). The c-Kit gene encodes a receptor tyrosine kinase essential for cell survival and proliferation, and mutations or dysregulation in c-Kit signaling pathways can lead to metabolic imbalances associated with diabetes (Lennartsson & Rönnstrand, 2012). This indicates possible roles in the cause and development of diabetes. Significant pathways like hematopoietic cell lineage, melanogenesis, and phospholipase D are involved with signaling in diabetes (Figure 6).
The study’s findings shed important light on the molecular processes for Type 2 diabetes. The variations in the expression of specific genes show their critical role in the pathogenesis of the illness. For example, the MAPK signaling pathway’s contribution to a number of cellular functions, including growth, differentiation, and apoptosis, highlights its significance in diabetes. The discovery of these pathways and the genes linked to them may open the door to potential cures for this disease.
These results found from the study could be used to develop a potential cure for diabetes by isolating which genes to target for a cure. With the knowledge of what genes correlate to diabetes any potential cure could target the same genes to eliminate the disease. However, a limitation in the study was the small sample size, as well as the lack of diversity in sample sources, sample types. This leads to an overall limitation of bioinformatics, not directly collecting samples from human subjects or animals. This requires the experiment conducted in this research to be replicated in the lab before used for development for a cure. The identified genes were tested in the laboratory by scientists in the laboratory or clinical trials to determine if there are any potential cell inhibitors that could limit the upregulation of the gene, as well as suppress it, taking away its correlation to diabetes.
Conclusion
This study successfully found differentially expressed genes (DEGs) in diabetic samples, highlighting key genes and pathways involved in Type 2 diabetes. The top DEGs, such as SFC, RKTs, GF, and c-Kit, were linked to significant biological processes relating to diabetes. Pathway analyses revealed critical pathways like the hematopoietic cell lineage, phospholipase D signaling, and insulin signaling, which are essential in understanding the complex mechanisms of the disease.
The results show that these DEGs and associated pathways play a crucial role in the development of Type 2 diabetes. These findings provide a great foundation for further research, particularly in exploring therapeutic targets and developing new treatments for diabetes.
Future studies should include larger and more diverse sample sizes to validate these findings and identify additional genes and pathways involved in Type 2 diabetes. Laboratory experiments and clinical trials are crucial to further explore the identified genes and pathways, aiming to develop effective strategies for prevention and treatment. All in all, this study was successful in finding the upregulated genes responsible for diabetes.
References
- Barrett, T. (2004). NCBI GEO: Mining Millions of Expression Profiles–Database and Tools. Nucleic Acids Research, 33(Database issue), D562–D566. https://doi.org/10.1093/nar/gki022
- Dayeh, T., Volkov, P., Salo, S., Hall, E., Nilsson, E., Olsson, A. H., Kirkpatrick, C. L., Wollheim, C. B., Eliasson, L., Rönn, T., Bacos, K., Ling, C. (2014). Genome-wide DNA methylation profiling of human pancreatic islets from type 2 diabetic and non-diabetic donors. Gene Expression Omnibus, GSE53166. Available at: https://www.ncbi.nlm.nih.gov/geo/query/acc.cgi?acc=GSE21232
- Dye, C., & Maunakea, A. (2024). A type 2 diabetes DNA methylation signature in monocytes exhibits ethnic specificity preferentially for Native Hawaiians. Gene Expression Omnibus, GSE270223. Available at: https://www.ncbi.nlm.nih.gov/geo/query/acc.cgi?acc=GSE270223
- European Journal of Medical Research. (2023). Identification and validation of core genes for type 2 diabetes mellitus by integrated analysis of single-cell and bulk RNA-sequencing. Retrieved from https://eurjmedres.biomedcentral.com/articles/10.1186/s40001-023-00617-5
- Gene Ontology Consortium. (2015). Gene Ontology Consortium: going forward. Nucleic Acids Research, 43(Database issue), D1049-56. https://doi.org/10.1093/nar/gku1179
- Gene Ontology (GO) Tools. Retrieved from http://bioinformatics.sdstate.edu/go/
- Grandl, G., Müller, T., Lickert, H., et al. (2024). Global, neuronal or β cell-specific deletion of inceptor improves glucose homeostasis in male mice with diet-induced obesity. Nature Metabolism. https://doi.org/10.1038/s42255-024-00991-3
- Gottlieb, M., & Dyer, S. (2020). Information and disinformation: Social media in the COVID-19 crisis. Academic Emergency Medicine, 27(9), 844-846. https://doi.org/10.1111/acem.14076
- Helmholtz Association of German Research Centres. (2024, February 28). Insulin-inhibitory receptor research offers hope for type 2 diabetes therapy. Medical Xpress. Retrieved July 22, 2024, from https://medicalxpress.com/news/2024-02-insulin-inhibitory-receptor-diabetes-therapy.html
- Human Genomics. (2022). Gene expression analysis reveals diabetes-related gene signatures. Retrieved from https://humgenomics.biomedcentral.com/articles/10.1186/s40246-022-00387-4
- IBAB Gene Identifier. Retrieved from http://resource.ibab.ac.in/GIDCON/geneid/home.html
- Kahn, C. R. (1994). Insulin action, diabetes genes, and the cause of type II diabetes. Diabetes, 43(8), 1066-1084. https://doi.org/10.2337/diab.43.8.1066
- Kanehisa, M., Furumichi, M., Tanabe, M., Sato, Y., & Morishima, K. (2017). KEGG: new perspectives on genomes, pathways, diseases and drugs. Nucleic Acids Research, 45(D1), D353-D361. https://doi.org/10.1093/nar/gkw1092
- Kang, J., Lee, H., Joo, J. Y., Song, J. M., et al. (2024). Comparison of genetic and epigenetic profiles of periodontitis according to the presence of type 2 diabetes. MedCom, 5(7), e620. https://doi.org/10.1002/mco2.620
- Lloyd, M. W., Srivastava, A., Baker, C. N., Lek, S. H., Gerdes Gyuricza, I., Emerson, J., Barter, M. E., Tjong, H., Munger, H., Maurya, R., Schott, W., Adams, A., Gaca, M., Ngan, C. Y., Wei, C., Braun, M., Attie, A. D., Keller, M. P., Stitzel, M. L., Churchill, G. A. (2023). Identification of cross-species preserved cis-regulatory elements containing type 2 diabetes GWAS variants (pcHiC). Gene Expression Omnibus, GSE214107. Available at: https://www.ncbi.nlm.nih.gov/geo/query/acc.cgi?acc=GSE214107
- Maayan Lab. (2023). Enrichment analysis of genes upregulated in type 2 diabetes mellitus. Datasets Tools. Retrieved from https://maayanlab.cloud
- McDonald, A., & Yateman, M. E. (1999). Growth factors in diabetes. In Joslin’s Diabetes Mellitus (pp. 373-384).
- Rajalahti, T., Arneberg, R., Berven, F. S., Myhr, K. M., Ulvik, R. J., & Kvalheim, O. M. (2009). Discriminating Variable Test and Selectivity Ratio Plot: Quantitative Tools for Interpretation and Variable (Biomarker) Selection in Complex Spectral or Chromatographic Profiles. Analytical Chemistry, 81(7), 2581–2590. https://doi.org/10.1021/ac802514y
- Schlessinger, J. (2000). Cell signaling by receptor tyrosine kinases. Cell, 103(2), 211-225. https://doi.org/10.1016/S0092-8674(00)00114-8
- White, M. F. (1998). The IRS-signaling system: A network of docking proteins that mediate insulin action. Molecular and Cellular Biochemistry, 182(1-2), 3-11. https://doi.org/10.1023/A:1006828325900
- Xue, D., Narisu, N., Taylor, D. L., Zhang, M., Grenko, C., Yan, T., Sinha, N., Erdos, M. R., Swift, A. J., Bonnycastle, L. L., Chen, S., Collins, F. S. (2023). Functional interrogation of twenty Type 2 Diabetes-associated genes using isogenic hESC-derived β-like cells [WGS]. Gene Expression Omnibus, GSE239329. Available at: https://www.ncbi.nlm.nih.gov/geo/query/acc.cgi?acc=GSE239329

