Utilizing Bioinformatics to Investigate Differences in Regulation of Gene Activity Between Whipple’s Disease Affected and Asymptomatic Populations

ABSTRACT
Background
Whipple’s disease is a rare and complex chronic infection caused by Tropheryma whipplei, primarily affecting the digestive system and potentially spreading to other organs. The infection begins in the small intestine, leading to symptoms like diarrhea, stomach pain, and weight loss. As it progresses, it can affect other organs, causing neurological issues such as memory loss and confusion. The disease primarily affects middle-aged males in North America and Europe, but the way it enters the human body and its origin remain unclear. Misdiagnosis is common due to its wide range of symptoms. This disease’s wide-ranging symptoms and rarity make it difficult to diagnose and treat effectively. What makes this disease especially mysterious is that it is extremely rare, with only a few hundred cases around the world, and due to its wide array of effects across different organs in the body, its molecular mechanisms and patterns are poorly understood. This wide range of symptoms often leads to misdiagnosis, as it can mimic more common diseases like rheumatoid arthritis, celiac disease, or neurological disorders. The main objective of this research is to determine the effect of the levels of expression of certain genes in affected patients. This will be accomplished with the use of various bioinformatics tools to analyze and understand the significance of expression levels of certain genes found in the affected samples.
Methods
The bioinformatics databases that were used to conduct this research included the website for the National Center for Biotechnology Information (NCBI), NCBI’s gene expression omnibus (GEO2r) tool and ShinyGO. GEO2R was used for analyzing pre existing primary research based on a study comparing two types of samples involved with Whipple’s disease, unaffected and affected. The GEO Dataset that was used was #GSE20209. The primary research focused on using whole genome microarray analysis to pinpoint gene expression changes in interleukin-16-knock-out bone-marrow-derived macrophages after infection with T. whipplei. Following a 6-hour bacterial exposure, researchers discovered a specific gene expression pattern that set infected samples apart from uninfected ones. To validate these results, they employed real-time PCR to measure the expression levels of several key genes within the same RNA samples, confirming the predicted macrophage response. The samples from the dataset were defined into two groups: affected and control (unaffected). There were three samples in each group, totaling 6 samples. After performing an analysis of the sample, the top 50 most differentially expressed genes (DEGs) were selected for further analysis via ShinyGO. ShinyGO produced a collection of various charts by assorting these top 50 DEGs into various molecular pathways, and associated molecules.
Results
A total of 53518 DEGs were identified upon analysis. As shown in Figure 1, there seemed to be more upregulated genes than downregulated ones. The top 8 GO terms upon enrichment using ShinyGO include ECM-receptor interaction, TNF signaling pathway, Rheumatoid arthritis, IL-17 signaling pathway, AGE-RAGE signaling pathway in diabetic complications, Amoebiasis, Protein digestion and absorption, and C-type lectin receptor signaling pathway.
Conclusion
Overall, the study revealed that the genes coding for the ECM-receptor interaction and TNF signaling pathway were the most significant in the enriched sample. Collagen was particularly repetitive, suggesting its role as a potential biomarker for future diagnosis or clinical trials. These findings can be used to understand how Whipple’s disease moves across the body for infection as well as proper prevention.
INTRODUCTION
Whipple’s disease is a rare chronic infectious disease caused by the gram-positive bacterium T. whipplei (Antunes & Singhal, 23). The bacterial infection begins in the digestive system, where vital organs reside, such as the small intestines. The bacteria penetrates the layers of the small intestines, causing lots of inflammation and poor digestion of the food passing through it leading to symptoms such as diarrhea, stomach pain and cramping, and weight loss (Boumaza et al., 2022). As the bacteria makes its way into other regions of the body, such as the nervous system, it can cause neurological symptoms including dementia, memory loss, confusion, difficulty finding words, lack of control of eye movements, and even personality changes (Song et al., 2023). Prior research has found that people who are usually male, middle-aged, and located in North America and Europe are more prone to this infection (Melas et al., 2021). Further studies have established the fact that the bacteria can reside in locations such as farming areas, where the water can be contaminated (Johnson, 2021). However, the bacteria’s true origin and its exact way of entry into the body are unknown.
Existing research has proven the many symptoms of this disease as well as the best way to keep the effects of the bacteria under control: antibiotic treatment (Bai, 2004). Inspection often involves a biopsy of the affected tissue, typically from the small intestine, showing characteristic findings under a microscope, such as the presence of periodic acid-Schiff (PAS) positive macrophages (Bakkali et al., 2008). Polymerase chain reaction (PCR) testing for T. whipplei DNA can also confirm the diagnosis (Dolmans 2017).
This study investigates how gene expression levels differ between individuals with Whipple’s disease and unaffected controls. Using bioinformatics tools, this research analyzes gene expression data from infected and non-infected samples to identify significant differentially expressed genes. The goal is to uncover key molecular pathways involved in the disease and enhance understanding of its progression and diagnosis. This aim is to analyze gene expression differences between Whipple’s disease patients and unaffected controls. The hypothesis is that there will be notable differences in gene expression patterns. This research is crucial for improving the understanding of Whipple’s disease and its molecular mechanisms. Identifying key gene expression changes could enhance diagnostic accuracy and lead to potential biomarkers for early detection. The findings may also inform new treatment strategies, making the research valuable for better managing this rare and complex disease.
METHODS
NCBI and Primary Research
This research utilized bioinformatics databases from the National Center for Biotechnology Information (NCBI), the GEO2R tool (NCBI, “GEO2R”). The dataset being used was focused on a primary study that analyzed gene expression changes in response to T. whipplei infection using affected macrophages from bone marrow. The accession number for this dataset is #GSE20209. The primary research involved a whole genome microarray analysis of interleukin-16-knock-out bone-marrow-derived macrophages, examining how gene expression was altered after a 6-hour exposure to the bacteria (GEO2R, 2010). Distinct gene expression patterns differentiated infected samples from uninfected ones and validated these findings using real-time PCR on the same RNA samples.
GEO2R Analysis
The dataset included two groups: affected (infected) and control (unaffected), with three samples in each group, making a total of six samples. The two groups were defined such that 3 samples were put into ‘affected’, and three into ‘control’. Analysis was performed via the “Analyze with GEO2R” option. The GEO2R bioinformatics tools use R programming that is pre-set with AI and machine learning algorithms. The linked R script gives more information about how the program works: R Script used to generate GEO2R results. Thereafter, the top 50 most significantly differentially expressed genes (DEGs) were identified and chosen for further examination using ShinyGO.
ShinyGO Bioinformatics Analysis
The top 50 DEGs were uploaded to a Google sheet in order, and their gene symbols were taken. These 50 gene symbols were then uploaded into the empty box on the ShinyGO bioinformatics website. After entering the symbols, analysis was performed using the “submit” option which yielded various charts and diagrams on the right, ranging from charts sorted by log fold, number of genes, pathways, and more. After comprehending these charts, the top two most enriched pathways, the ECM-receptor interaction and TNF signaling pathway were acknowledged as the most significant in the affected sample involving Whipple’s disease.
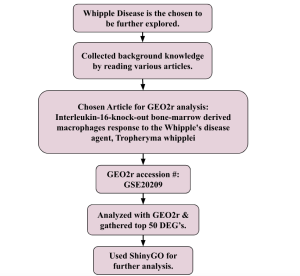
Figure 1. Showing experimental design.
Steps to obtain the results
To obtain the results, multiple bioinformatics tools and databases were utilized, including the National Center for Biotechnology Information (NCBI), GEO2R, and ShinyGO. The process began by identifying a relevant GEO dataset focused on Whipple’s disease, specifically Dataset #GSE20209. This dataset included two groups: affected (infected) and control (unaffected), with three samples in each group, totaling six samples. The primary research involved using a whole genome microarray to investigate gene expression changes in bone-marrow-derived macrophages after a 6-hour exposure to T. whipplei bacteria.
The analysis started by accessing GEO2R, a tool within NCBI, which enables users to compare gene expression in different sample groups. By selecting the “Analyze with GEO2R” option, the expression levels of genes in affected versus control samples were compared. GEO2R uses R programming pre-configured with AI and machine learning algorithms to carry out this differential gene expression analysis. This comparison identified a total of 53,518 differentially expressed genes (DEGs). Among these, the top 50 most significantly different DEGs were selected for further pathway analysis.
These top 50 DEGs were then organized in a Google Sheet, where their gene symbols were listed and copied. The next step was to input these gene symbols into the ShinyGO tool, a web-based application used for functional enrichment analysis and visualization. By entering the gene symbols into the designated field and selecting the “submit” option, ShinyGO generated various charts and diagrams. These visual outputs included pathway analyses, gene ontology terms, and molecular interactions based on the inputted DEGs.
From the generated results, the pathways were assessed, with a particular focus on the most enriched pathways relevant to Whipple’s disease. Among the outputs, the ECM-receptor interaction and TNF signaling pathways emerged as the most significant in distinguishing affected samples from controls.
RESULTS
GEO2R Results: Identification of Differentially Expressed Genes
In this research, 50 DEGs were identified based on fold change and p values. There were 25 upregulated and 25 downregulated genes included in the GEO2R Top 50 DEGs Google Sheet. Using ShinyGO, these top DEGs were analyzed to produce charts containing the matching processes, pathways, and associated molecules. Some of the top pathways include ECM-receptor interaction, TNF signaling pathway, Rheumatoid arthritis, and the IL-17 signaling pathway. The top two were taken into account due to the number of DEGs associated with them.
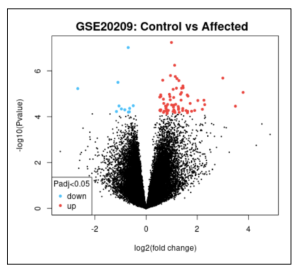
Figure 2. Volcano Plot. This volcano plot shows 52518 differentially expressed genes (DEGs) represented with each dot, both red and blue. Red dots represent upregulated genes, and blue dots represent downregulated genes. More genes were turned “on.”
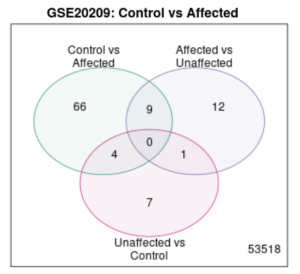
Figure 3. Venn Diagram. Within a total of 53518 genes, there were no common genes expressed in both groups, when taking “unaffected” into account, however, there is some regional overlapping between any two given groups.
Identification of Significantly Expressed Genes and Key Pathways in Whipple’s Disease Using ShinyGO Analysis
To further analyze the identified differentially expressed genes, the ShinyGO bioinformatics tool was used and it produced a collection of various charts by assorting these top 50 DEGs into various molecular pathways, and associated molecules.
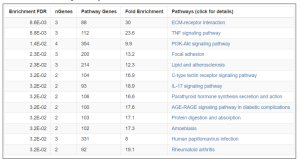
Figure 4. Enrichment Chart. In this chart, fold enrichment was taken into consideration among all factors for measurement of how significant the pathways are. Fold Enrichment measures the magnitude of enrichment. Higher values indicate stronger enrichment and are an important metric of effect size. As shown, the ECM-receptor interaction and TNF signaling pathway have the highest enrichment scores with 30 and 23.6, respectively indicating their significance.
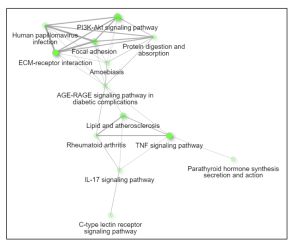
Figure 5. Network. This interactive plot shows the relationship between enriched pathways. Two pathways (nodes) are connected if they share 20% or more genes. Brighter nodes indicate more significantly enriched gene sets and larger nodes represent bigger gene sets.
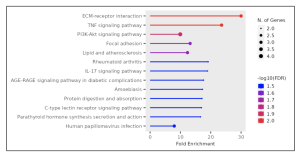
Figure 6. Lollipop chart. The thicker dots represent more enriched pathways with more genes involved from the selected 50 DEGs. The most enriched signaling pathways were the ECM-receptor interaction, TNF signaling pathway, and the PI3K-Akt, but only the top two were taken into account in this study due to their FDR value and color, represented as a scale of blue to red, with 2.0 as the brightest red shade. Only the top two pathways had an FDR value of 2.0.
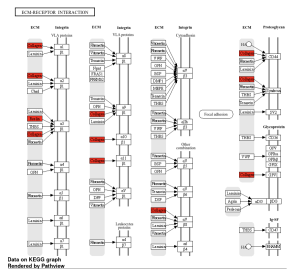
Figure 7. ECM-receptor interaction KEGG Pathway. Integrin proteins and proteoglycan were involved in the ECM-Receptor interaction. Collagen plays a large role in this pathway due to its repetition as shown in red, along with one other gene, Reelin.
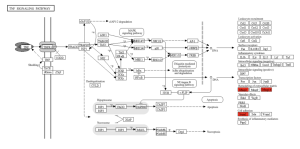
Figure 8. TNF Signaling Pathway. The genes Mmp3, Mmp14, and 1cam1 are involved in the remodeling of the extracellular matrix and cell adhesion in the TNF signaling pathway, respectively.
Table 1. Summary of Findings
Significant Genes from Enrichment analysis (based on repetition) | KEGG Pathways | Common Results |
COL2A1 | ECM-receptor interaction & COL2A1 and Reelin | COL2A1 |
TNF signaling pathway & Mmp3, Mmp14, and 1cam1 |
Supplementary Materials
R Script: R Script used to generate GEO2R results
Top 50 DEGs: GEO2R Top 50 DEGs Google Sheet
DISCUSSION
The primary goal of this research was to investigate gene expression differences between individuals affected by Whipple’s disease and unaffected controls. Using bioinformatics tools such as GEO2R and ShinyGO, the study analyzed gene expression data from macrophages exposed to T. whipplei. The analysis identified the top 50 differentially expressed genes (DEGs) as shown in the Google sheet, with significant involvement in pathways (figure 5) such as ECM-receptor interaction (figure 6) and TNF signaling (figure 7). These findings suggest that specific genes, particularly those related to immune response and inflammation, play a crucial role in the disease’s progression and could serve as potential biomarkers for diagnosis and treatment.
The findings of this study align with previous research on Whipple’s disease, particularly in terms of the role of the extracellular matrix (ECM) and the TNF signaling pathway (Wang et al., 2020). Previous studies have also indicated that Whipple’s disease involves significant disruptions in ECM interactions and chronic inflammation, often driven by TNF signaling (Jarosz-Griffiths et al., 2019). For example, the upregulation of ECM-related genes and inflammatory pathways has been documented in other research focusing on the immunological and pathological aspects of Whipple’s disease (Friebel et al., 2022).
However, this study adds a nuanced perspective by identifying specific gene expression patterns and pathways involved, particularly the role of collagen (figure 6) and the ECM-receptor interaction (figures 5 and 6) in disease progression. This detailed gene expression analysis and pathway enrichment extend previous knowledge by providing more specific insights into the molecular mechanisms underlying Whipple’s disease.
ECM-receptor interaction
The extracellular matrix (ECM) and its interaction with cellular receptors play a significant role in the pathogenesis of Whipple’s disease. The ECM is a complex network of proteins, including collagen, that provides structural support to tissues and facilitates cell signaling (Büttner, 2018). In Whipple’s disease, the interaction between the ECM and its receptors is disrupted by the presence of the bacterium Tropheryma whipplei, leading to chronic inflammation and tissue damage. This disruption contributes to symptoms such as diarrhea, malabsorption, and systemic manifestations as the disease progresses. Specifically, the upregulation of ECM-related genes in affected individuals suggests that changes in ECM composition may be involved in the immune response and tissue remodeling processes seen in Whipple’s disease. Such alterations can exacerbate the disease’s impact on the digestive system and other organs, leading to the diverse and severe symptoms observed in patients (Soles, 2023).
TNF signaling pathway
The TNF (Tumor Necrosis Factor) signaling pathway is closely linked to the inflammatory processes observed in Whipple’s disease. TNF is a cytokine that plays a critical role in the body’s immune response, particularly in regulating inflammation (Holbrook et al., 2019). In Whipple’s disease, the bacterium Tropheryma whipplei triggers an abnormal immune response, leading to the activation of the TNF signaling pathway. This pathway contributes to the chronic inflammation seen in the disease, which damages the intestinal lining and other tissues. The persistent activation of TNF signaling can exacerbate symptoms such as abdominal pain, diarrhea, and systemic inflammation, as well as potentially contribute to the neurological symptoms associated with the disease (Parameswaran & Patial, 2010). The dysregulation of TNF and its associated pathways underscores the complexity of Whipple’s disease and highlights the importance of targeting this pathway in potential therapeutic strategies.
COL2A1
Collagen, particularly the type II alpha 1 chain gene (COL2A1), plays a significant role in the pathology of Whipple’s disease. Collagen is a primary component of the extracellular matrix (ECM) and is crucial for maintaining the structural integrity of tissues. In Whipple’s disease, the expression of collagen-related genes like COL2A1 can be altered due to the chronic inflammation caused by Tropheryma whipplei. This can lead to excessive deposition of collagen and other ECM components, contributing to fibrosis and tissue remodeling (Di Stefano et al., 1998). Such changes are associated with the characteristic symptoms of Whipple’s disease, including malabsorption and gastrointestinal distress, as the normal architecture of the intestinal lining is disrupted. Furthermore, the involvement of collagen in the ECM-receptor interaction and TNF signaling pathways suggests that it may play a role in the disease’s progression by exacerbating inflammation and tissue damage.
In summary, the identification of collagen and ECM-receptor interactions as key factors in Whipple’s disease opens up potential avenues for developing diagnostic biomarkers and therapeutic targets. For instance, collagen-related genes like COL2A1 could be further explored as biomarkers for early detection or progression of the disease.
A limitation of this research is that the study’s analysis was based on only six samples (three affected and three controls), which may not be representative of the broader population or account for variability in the disease. Further, because we used bioinformatic datasets derived from microarray experiments conducted by other researchers, a limitation of this study is that the identified genes will need further investigation in a laboratory or clinical setting.
There are several avenues for future research. First, this research can be continued in a lab or clinical setting to validate the role of collagen (e.g., COL2A1) and other identified biomarkers in Whipple’s disease. This involves testing these biomarkers in larger and more diverse patient cohorts to confirm their utility. Second, more research can be done to develop and refine diagnostic assays based on validated biomarkers. This could include creating blood tests or tissue assays to detect early signs of Whipple’s disease or assess disease progression.
As for potential vaccinations in the future, identifying and validating specific antigens of T. whipplei that could be targeted by a vaccine. Research into the bacterium’s surface proteins or secreted factors might reveal potential vaccine targets.
Conclusion
This study found that the ECM-receptor interaction and TNF signaling pathway are connected to Whipple’s disease through altered gene expression, particularly involving high levels of collagen and other extracellular matrix components in patients suffering from Whipple’s disease.
References
- Antunes, C., & Singhal, M. (2023, July 4). Whipple Disease. StatPearls – NCBI Bookshelf.
- Bai, J. C., Mazure, R. M., Vazquez, H., Niveloni, S. I., Smecuol, E., Pedreira, S., & Mauriño, E. (2004). Whipple’s disease. Clinical Gastroenterology and Hepatology, 2(10), 849–860. https://doi.org/10.1016/S1542-3565(04)00387-8
- Bakkali, N., Fenollar, F., Biswas, S., Rolain, J., & Raoult, D. (2008). Acquired resistance to trimethoprim‐sulfamethoxazole during Whipple disease and expression of the causative target gene. The Journal of Infectious Diseases, 198(1), 101–108. https://doi.org/10.1086/588706
- Boumaza, A., Azzouz, E. B., Arrindell, J., Lepidi, H., Mezouar, S., & Desnues, B. (2022). Whipple’s disease and Tropheryma whipplei infections: From bench to bedside. The Lancet Infectious Diseases, 22(10), e280–e291. https://doi.org/10.1016/s1473-3099(22)00128-1
- Büttner, P., Ueberham, L., Shoemaker, M. B., Roden, D. M., Dinov, B., Hindricks, G., Bollmann, A., & Husser, D. (2018). Identification of central regulators of calcium signaling and ECM–Receptor interaction genetically associated with the progression and recurrence of atrial fibrillation. Frontiers in Genetics, 9, 162. https://doi.org/10.3389/fgene.2018.00162
- Di Stefano, M., Jorizzo, R. A., Brusco, G., Cecchetti, L., Sciarra, G., Loperfido, S., Brandi, G., Gasbarrini, G., & Corazza, G. R. (1998). Bone mass and metabolism in Whipple’s disease: The role of hypogonadism. Scandinavian Journal of Gastroenterology, 33(11), 1180–1185. https://doi.org/10.1080/00365529850172548
- Dolmans, R. a. V., Boel, C. H. E., Lacle, M. M., & Kusters, J. G. (2017). Clinical manifestations, treatment, and diagnosis of Tropheryma whipplei infections. Clinical Microbiology Reviews, 30(2), 529–555. https://doi.org/10.1128/cmr.00033-16
- Friebel, J., Schinnerling, K., Geelhaar‐Karsch, A., Allers, K., Schneider, T., & Moos, V. (2022). Intestinal barrier dysfunction mediates Whipple’s disease immune reconstitution inflammatory syndrome (IRIS). Immunity Inflammation and Disease, 10(5), 622. https://doi.org/10.1002/iid3.622
- GEO Accession viewer. (2010). https://www.ncbi.nlm.nih.gov/geo/query/acc.cgi?acc=GSE20209
- GEO2R. (n.d.). NCBI – U.S. National Library of Medicine. https://www.ncbi.nlm.nih.gov/geo/info/geo2r.html
- Holbrook, J., Lara-Reyna, S., Jarosz-Griffiths, H., & McDermott, M. F. (2019). Tumour necrosis factor signalling in health and disease. F1000Research, 8, 111. https://doi.org/10.12688/f1000research.17023.1
- Jarosz-Griffiths, H. H., Holbrook, J., Lara-Reyna, S., & McDermott, M. F. (2019). TNF receptor signalling in autoinflammatory diseases. International Immunology, 31(10), 639–648. https://doi.org/10.1093/intimm/dxz024
- Johnson, S. (2021, July 12). Whipple’s Disease. Healthline. https://www.healthline.com/health/whipples-disease
- Melas, N., Amin, R., Gyllemark, P., Younes, A. H., & Almer, S. (2021). Whipple’s disease: The great masquerader—a high level of suspicion is the key to diagnosis. BMC Gastroenterology, 21(1), 664. https://doi.org/10.1186/s12876-021-01664-1
- Parameswaran, N., & Patial, S. (2010). Tumor necrosis factor-α signaling in macrophages. Critical Reviews in Eukaryotic Gene Expression, 20(2), 87–103. https://doi.org/10.1615/critreveukargeneexpr.v20.i2.10
- ShinyGO 0.80. (n.d.). http://bioinformatics.sdstate.edu/go/
- Soles, A., Selimovic, A., Sbrocco, K., Ghannoum, F., Hamel, K., Moncada, E. L., Gilliat, S., & Cvetanovic, M. (2023). Extracellular matrix regulation in physiology and in brain disease. International Journal of Molecular Sciences, 24(8), 7049. https://doi.org/10.3390/ijms24087049
- Song, X., Duan, R., Duan, L., & Wei, L. (2023). Current knowledge of the immune reconstitution inflammatory syndrome in Whipple disease: A review. Frontiers in Immunology, 14, 1265414. https://doi.org/10.3389/fimmu.2023.1265414
- Wang, Y., Zhang, H., Chen, Q., Jiao, F., Shi, C., Pei, M., Lv, J., Zhang, H., Wang, L., & Gong, Z. (2020). TNF‐α/HMGB1 inflammation signalling pathway regulates pyroptosis during liver failure and acute kidney injury. Cell Proliferation, 53(6), 12829. https://doi.org/10.1111/cpr.12829

