Using Bioinformatics to Locate Genes Affected by Staphylococcus aureus and their Effects on Sepsis

ABSTRACT
As the largest and most vulnerable organ system, the skin is teeming with bacteria that are usually commensal. However, there are some that are opportunistic pathogens like Staphylococcus aureus which find a way to invade the skin and go into the bloodstream. The harms brought by S. aureus include conditions like sepsis, which is an inflammatory response that is unregulated, thus damaging organs inside the body and leading to death. While there have been experiments trying to identify how to neutralize the effect of S. aureus, there is still a lack of clarity regarding the genes that are being dysregulated by S. aureus in the human blood that cause sepsis. Therefore, to fill this gap, this research aimed to find genes that can be used in gene therapy to stop people infected by S. aureus from dying of sepsis. This research used bioinformatics tools called GEO2R to find genes that are active in sepsis. We first identified the top 30 genes that are expressed differently between infected patients and healthy individuals. Then we used another bioinformatics tool, SR Plot, to analyze these genes via gene ontology (GO) and KEGG bioinformatics databases. This analysis found two key genes, UTY and KDM5D, that affect sepsis by influencing histone demethylase activity which is a factor that is closely related with sepsis inflammatory function and behavior. With more testing and research, these genes might help develop gene therapy to prevent sepsis deaths caused by S. aureus.
INTRODUCTION
This research is addressing the potential for a decrease in deaths by sepsis for human beings. Sepsis is a syndrome that causes organ failure due to an incorrect response to an infection (Raymund B Dantes, Lauren Epstein, 2018). In the United States alone, sepsis causes about 265 thousand deaths a year. (Raymund B Dantes, Lauren Epstein, 2018) Staphylococcus aureus is one of the main causes of sepsis for humans (McAdow et. al, 2011). S. aureus normally resides on the human skin and is known to be an opportunistic pathogen as it causes many different types of infections (Parlet et. al, 2019). The bacteria causes a lot of infections as it frequently invades the skin of humans and goes into our bloodstream (Thomer et. al, 2016).
When S. aureus enters the bloodstream, it triggers an inflammatory response (Kwiecinski and Horswill, 2020). This inflammatory response can lead to sepsis as the excessive spread of inflammation throughout the body causes damage to organs in the body (Kwiecinski and Horswill, 2020). Annually, there are more than 35 thousand causes of sepsis related to the invasion of S. aureus (Thomer et. al, 2016). Although it is known that S. aureus leads to sepsis, scientists do not know what genes are related to the pathogenesis of sepsis and thus cannot create drugs that cure or inhibit sepsis (Li. et al, 2021). Therefore, this current research was conducted to fill this gap.
Specifically, the goal of this research study was to find out if there are key genes that S. aureus dysregulates in the human blood and if so what the key genes are. By doing this, scientists can gather a list of genes that should be targeted in future drugs to prevent sepsis such as gene therapy. Gene therapy is a medical technique that stops a disease by correcting the genetic issue causing it (Scheler and Krebsbach, 2009). To do this, scientists either add a new gene to the cells to fight the disease or replace the faulty gene with a healthy copy (Gonçalves and Paiva, 2017). Therefore, genes identified in this research study can be potentially used for gene therapy.
In order to conduct this research, different bioinformatics tools and databases were used. Specifically, I used gene expression data from public sources that is commonly used by research scientists today (Rung and Brazma, 2013). Analyzing gene expression using advanced methods like microarrays is important because they have promising uses in early diagnosis, finding potential cures or predicting outcomes for many diseases (Kulasingam and Diamandis, 2008). Therefore, in my research, I identified and used a Genome Expression Omnibus (GEO) dataset GSE237960 that used a microarray method tested the effects of S. aureus and E. coli on human blood as a way to figure out which genes are being dysregulated. These scientists were also trying to neutralize sepsis as these two bacteria are major causes of sepsis.
For my study I therefore used several bioinformatics tools namely, GEO2R (http://www.ncbi.nlm.nih.gov/geo/geo2r), SR Plot (http://www.bioinformatics.com.cn/srplot), to see if there are genes that could be the real cause of the infections by identifying which genes are expressed differentially between infected patients and healthy individuals and finally determine their potential functions and biological pathways using gene ontology (GO) and KEGG bioinformatics databases.
METHODS
Collecting Gene Expression Microarray Data from GEO2R Bioinformatics Tool
In order to investigate and identify the genes which through dysregulation by S. aureus play a role in a human being infected by sepsis, this research used a variety of bioinformatics tools. The overall process by which the research was conducted is shown in Figure 1 for clarity. In order to find a dataset, I sifted through the Gene Expression Omnibus (GEO) bioinformatics tool that is part of the NCBI website (Edgar et al., 2002). The National Center for Biotechnology Information (NCBI) is a website that contains a plethora of genomic data in order to allow researchers to access and conduct experiments with (Barrett et. al, 2009). NCBI’s main benefit is the fact that it contains analysis tools which allow researchers to not only obtain but also analyze the data that they obtained (Edgar et. al, 2002). Inside the GEO, there is one such tool called GEO2R which was used for the research. GEO2R uses algorithms to highlight the differentially-expressed genes (DEGs) between two groups that a user defined from the samples in the dataset (Clough and Barrett, 2016). DEGs are genes that have a difference in expression levels based on the state of the sample (Anjum et al, 2016).
In order to find a dataset that contained genes affected by S. aureus, I conducted a keyword search around S. aureus and sepsis. From this search, I got a dataset, GSE237960, that contains samples of unaffected human whole-blood (n = 4) as well as samples of human blood that was infected with heat-killed S. aureus (n = 3). This dataset, which is the GSE237960 dataset, was conducting an experiment that focused on the different signaling effects of S. aureus and E. coli in healthy and unaffected whole blood and the blood that is infected with heat-killed S. aureus. I excluded E. coli when using the GEO2R bioinformatic tool, as it is unrelated to the research that is being conducted.
Identifying DEGs that are statistically significant
Upon use of GEO2R, the difference between the S. aureus infected human blood and the unaffected human blood from the dataset GSE237960 was generated using pre-programmed AI and ML algorithms using the R programming language (Supplementary Data: GEO2R Analysis R-script). The results are shown as differentially expressed genes (DEGs) in the volcano plot of Figure 2 with some genes upregulated and some genes downregulated. For this study, we decided to consider differentially expressed genes (DEG) that had a p-value < 0.05 and |logFC| ≥ 1 as statistically significant (Supplementary Results: Top 30 DEGs).
Using SR Plot Bioinformatics tool to determine functions and biological pathways of selected DEGs
In order to analyze the results that were obtained for key genes related to sepsis, the top 30 DEGs (Supplementary Results: Top 30 DEGs ) were picked and imported into the SR Plot bioinformatics tool (https://www.bioinformatics.com.cn/srplot ). SR Plot is a bioinformatics tool that contains a lot of algorithms that allow users to visualize and analyze inputted biological data through graphs and other outputs (Tang et. al, 2023). The two analyses that I performed with SR Plot are called Gene Ontology (GO) and Kyoto Encyclopedia of Genes and Genomes (KEGG) pathway enrichment analysis. GO contains ontologies, a set of vocabularies, that are used to describe biological process (BP), cellular component (CC), and molecular function (MF) (Harris et. al, 2004). KEGG is a database used for the analysis of genomic sequences and to find biological pathways that genes might be involved in (Kanehisa and Goto, 2000).
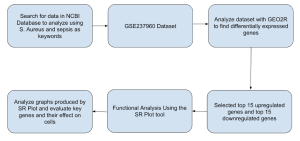
Figure 1: Methodology Flowchart: Overview of the methodology used in this bioinformatics study
RESULTS
Identification of top DEGs
In this study, differentially-expressed genes (DEGs) were analyzed to figure out which genes play a role in promoting and creating sepsis. DEGs are genes that have a statistically significant change in expression level when they are put in different experimental conditions (Chen et. al, 2021). The aforementioned different experimental conditions that DEGs change in are, in this research, the healthy and unaffected whole blood and the blood that is infected with heat-killed S. aureus. The DEGs that are analyzed are either upregulated, which means that they are expressed at a higher level in one experimental condition than then the other, and downregulated meaning that it is expressed at a lower level (Xie et. al, 2020).
Using GEO2R, the top DEGs in the GSE237960 dataset between the control and the S. aureus infected cells were shown clearly. In the volcano plot below (Figure 2), the red dots signify upregulated DEGs, the blue represent downregulated genes, and the black are not statistically significant enough (p ≥ 0.05) to be DEGs (Figure 2). After getting the list of DEGs downloaded, the top 15 upregulated DEGs and the top 15 downregulated DEGs were picked after narrowing the list down by deleting the DEGs that were not statistically significant (p ≥ 0.05) (Supplementary Results: Top 30 DEGs ).
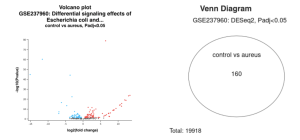
Figure 2a. Volcano plot showing the magnitude of differential expression in the healthy samples vs the samples infected with S. aureus. The blue dots represent genes that are up-regulated.while the blue dots represent genes that are down-regulated. | Figure 2b. A venn diagram portraying the amount of genes expressed at similar levels between the control (n = 4) and the infected (n = 3) groups. The 160 represents genes that re expressed differently between the control and infected. On the other hand, the 19918 shows all the genes identified in this study. |
Functional analysis of the top DEGs
After identifying the top 30 DEGs, the genes were imported into SR Plot bioinformatics tool in order to understand how the dysregulation of these genes affected the cell and its function as well as evaluate whether this change in cell function could be related to sepsis. Using the SR Plot bioinformatics tool, GO and KEGG pathway enrichment analysis were carried out on the DEGs. The results showed that histone lysine demethylation, histone demethylation, and protein demethylation were the major biological processes that were affected by the DEGs (Figure 3). It also shows that the histone methyltransferase complex is the most enriched cellular component and the histone demethylase activity is the most enriched molecular function (Figure 3).
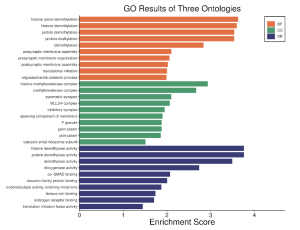
Figure 3. The GO pathway enrichment results. These results show the main biological processes (BP), cellular components (CC), and molecular functions (MF) represented within the top DEGs.
Further, the SR Plot revealed several genes that were involved in the major KEGG pathways (Figure 7) as well as the major genes that played a part in the biological processes (BP) (Figure 4), cellular components (Figure 5), and molecular functions (Figure 6). For the BP, the significant genes included UTY, KDM5D, NLGN4Y, RPS4Y1, and EIF1AY and they were associated with the biological processes of demethylation, protein dealkylation, and translational initiation. For the CC, the significant genes included UTY, KDM5D, and DDX3Y and they affected the histone methyltransferase complex and MLL3/4 complex. The gene ontology terms for the MF that came from the genes UTY, KDM5D, USP9Y, NLGN4Y, and EIF1AY were related to histone demethylase activity and protein demethylase activity.
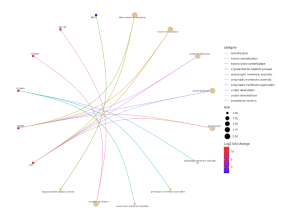
Figure 4. Effect the top 30 DEGs have on the biological process. The dots are genes that are red and blue and the strings lead to the biological processes that the genes are related to. The color of the gene dot shows the level at which each gene is dysregulated with red being the most significant.
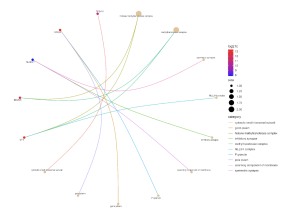
Figure 5. Effect the top 30 DEGs have on the cellular components. The dots are genes that are red and blue and the strings lead to the part of the cell that the genes are related to. The color of the gene dot shows the level at which each gene is dysregulated with red being the most significant.
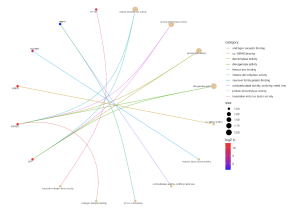
Figure 6. Effect the top 30 DEGs have on the molecular functions of the human blood. The dots are genes that are red and blue and the strings lead to the molecular functions that the genes are related to. The color of the gene dot shows the level at which each gene is dysregulated with red being the most significant.
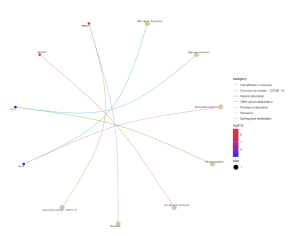
Figure 7. This graph shows the effect the top 30 DEGs have on biological pathways. The dots are genes that are red and blue and the strings lead to the biological pathways that the genes are related to. The color of the gene dot shows the level at which each gene is dysregulated with red being the most significant.
DISCUSSION
The goal of this research was to understand how S. aureus affects the genes in human blood cells when it invades into the bloodstream and determine if it was possible to create a drug that stopped S. aureus from causing sepsis. In order to figure this out, several bioinformatic tools were used to identify genes that are differentially expressed by the S. aureus signaling effects in patients versus healthy individuals and thus allow scientists interested in stopping sepsis to test these genes and see if the problem lies with the genes that were dysregulated. Dysregulated genes are differentially expressed genes that reflect statistically significant changes in RNA level or DNA expression in patients compared to healthy controls. In the case that they are, scientists can target the gene and neutralize the effects.
In order to fix these genes that were dysregulated by S. aureus, scientists can use gene therapy. Gene therapy is a medical approach that prevents a disease by fixing the genetic problem that causes it (Scheler and Krebsbach, 2009) To do gene therapy, scientists usually introduce a new gene into the cells that fights the disease or create a copy of the gene that is not altered by the disease to replace the one that is faulty (Gonçalves and Paiva, 2017).
When analyzing the top DEGs, it became clear that many genes were coding for histone demethylation at methyltransferase proteins. Methyltransferase proteins are enzymes that add one or more methyl groups to their substrates which include DNA, RNA, and protein (Boriack-Sjodin and Swinger, 2016). This change in the amount of certain methyltransferase proteins correlates to a promotion of sepsis as they play a crucial role in inflammation in the human body (Wu et. al, 2023). These methyltransferase proteins can change how genes involved in inflammation work thus potentially making the inflammation more or less harmful (Wu et. al, 2023). The methylation, the process of adding methyl groups to substrates, by these methyltransferase proteins can lead to faultiness in key mechanisms that regulate inflammation (Wu et. al, 2023) An example of this is the methylation of H3K4, which is a specific site where methylation can occur on the histone protein H3 (Wu et. al, 2023) The methylation of H3K4 supports the production of inflammatory cytokines which makes the inflammation larger (Wu et. al, 2023). This methylation can not only activate inflammatory genes but also downregulate methyltransferases that regulate the inflammation (Wu et. al, 2023). This methylation ultimately leads to prolonged inflammation and poor recovery, which are both symptoms experienced by people with sepsis (Wu et. al, 2023). This is also the case for demethylation as it can also change immune-related pathways when it has abnormal expression levels (Qu et. al, 2023). Overall, not only can methylation promote sepsis, but also demethylation which occurs in the samples infected by S. aureus.
From the results in Figure 4, Figure 5, and Figure 6, it is clear that there are two main genes that have been upregulated due to the infection by S. aureus. These two genes are UTY and KDM5D and they promote histone demethylation (Table 1). These two genes are the ones that were highlighted in this research because in Figure 4, Figure 5, and Figure 6, they are both red, meaning that there was a major change in expression level for the two genes. The upregulation of genes coding for histone methylation as well as the fact that these two genes are red in the graphs prove that these two genes promote sepsis due to the existence of S. aureus. Overall, S. aureus boosts histone demethylase activity through the top DEGs. Scientists can use the top DEGs, UTY and KDM5D (Table 1), in gene therapy by altering it to control histone demethylation, thus reducing inflammation and stopping sepsis from causing more deaths.
Table 1: A summary of the top two identified DEGs and their associated functions.
GENE ID | FUNCTION |
UTY | Activates histone demethylation, which has either a regulatory or detrimental effect to the inflammatory response that is taken against S. aureus invasion into the bloodstream |
KDM5D | Also activates histone demethylation, which has either a regulatory or detrimental effect to the inflammatory response that is taken against S. aureus invasion into the bloodstream |
Due to the fact that the bioinformatics dataset that was used in this study was from an experiment performed by other researchers, the key DEGs identified in my study (Table 1) need to be tested by other scientists in the laboratory or clinical setting to validate their potential use in gene therapy for sepsis. Additionally, in the future, I would like to examine more DEGs in the dataset I used because I was only able to identify 2 genes that had an effect on sepsis and there could be more hidden in the dataset. I also think it would be interesting if experiments could be done focusing on gene expression levels that occur during sepsis in humans as opposed to gene expression in the bacteria itself.
Conclusion
Overall, this research study’s purpose was to identify genes that can be potentially used in gene therapy to prevent patients who have been infected by S. aureus from dying by sepsis. In order to do this, the GEO2R bioinformatics tool was used to get differentially-expressed genes (DEGs) that potentially had an effect on sepsis. These genes were narrowed down further into 30 major DEGs and imported into SR Plot where GO and KEGG pathway enrichment analysis was done on the genes. These tools identified two major genes, UTY and KDM5D that have an impact on sepsis through their promotion of histone demethylase activity. Through further testing and research on these genes, gene therapy could be potentially formulated that ultimately stops deaths caused by sepsis due to S. aureus.
Supplementary Results
References
- Barrett, T., Troup, D. B., Wilhite, S. E., Ledoux, P., Rudnev, D., Evangelista, C., Kim, I. F., Soboleva, A., Tomashevsky, M., Marshall, K. A., Phillippy, K. H., Sherman, P. M., Muertter, R. N., & Edgar, R. (2009). NCBI GEO: archive for high-throughput functional genomic data. Nucleic acids research, 37(Database issue), D885–D890. https://doi.org/10.1093/nar/gkn764
- Boriack-Sjodin, P. A., & Swinger, K. K. (2016). Protein Methyltransferases: A Distinct, Diverse, and Dynamic Family of Enzymes. Biochemistry, 55(11), 1557–1569. https://doi.org/10.1021/acs.biochem.5b01129
- Chen, B., Gao, L., & Shang, X. (2021). A two-way rectification method for identifying differentially expressed genes by maximizing the co-function relationship. BMC genomics, 22(Suppl 1), 471. https://doi.org/10.1186/s12864-021-07772-2
- Clough, E., & Barrett, T. (2016). The Gene Expression Omnibus Database. Methods in molecular biology (Clifton, N.J.), 1418, 93–110. https://doi.org/10.1007/978-1-4939-3578-9_5
- Dantes, R. B., & Epstein, L. (2018). Combatting Sepsis: A Public Health Perspective. Clinical infectious diseases : an official publication of the Infectious Diseases Society of America, 67(8), 1300–1302. https://doi.org/10.1093/cid/ciy342
- Edgar, R., Domrachev, M., & Lash, A. E. (2002). Gene Expression Omnibus: NCBI gene expression and hybridization array data repository. Nucleic acids research, 30(1), 207–210. https://doi.org/10.1093/nar/30.1.207
- Gonçalves, G. A. R., & Paiva, R. M. A. (2017). Gene therapy: advances, challenges and perspectives. Einstein (Sao Paulo, Brazil), 15(3), 369–375. https://doi.org/10.1590/S1679-45082017RB4024
- Harris, M. A., Clark, J., Ireland, A., Lomax, J., Ashburner, M., Foulger, R., Eilbeck, K., Lewis, S., Marshall, B., Mungall, C., Richter, J., Rubin, G. M., Blake, J. A., Bult, C., Dolan, M., Drabkin, H., Eppig, J. T., Hill, D. P., Ni, L., Ringwald, M., … Gene Ontology Consortium (2004). The Gene Ontology (GO) database and informatics resource. Nucleic acids research, 32(Database issue), D258–D261. https://doi.org/10.1093/nar/gkh036
- Kulasingam, V., and Diamandis, E. P. (2008). Strategies for discovering novel cancer biomarkers through utilization of emerging technologies. Nat. Clin. Pract. Oncol. 5, 588–599. doi: 10.1038/ncponc1187
- McAdow, M., Kim, H. K., Dedent, A. C., Hendrickx, A. P., Schneewind, O., & Missiakas, D. M. (2011). Preventing Staphylococcus aureus sepsis through the inhibition of its agglutination in blood. PLoS pathogens, 7(10), e1002307. https://doi.org/10.1371/journal.ppat.1002307
- Parlet, C. P., Brown, M. M., & Horswill, A. R. (2019). Commensal Staphylococci Influence Staphylococcus aureus Skin Colonization and Disease. Trends in microbiology, 27(6), 497–507. https://doi.org/10.1016/j.tim.2019.01.008
- Rung, J., and Brazma, A. (2013). Reuse of public genome-wide gene expression data. Nat. Rev. Genet. 14, 89–99. doi: 10.1038/nrg3394
- Scheller, E. L., & Krebsbach, P. H. (2009). Gene therapy: design and prospects for craniofacial regeneration. Journal of dental research, 88(7), 585–596. https://doi.org/10.1177/0022034509337480
- Tang, D., Chen, M., Huang, X., Zhang, G., Zeng, L., Zhang, G., Wu, S., & Wang, Y. (2023). SRplot: A free online platform for data visualization and graphing. PloS one, 18(11), e0294236. https://doi.org/10.1371/journal.pone.0294236
- Thomer, L., Schneewind, O., & Missiakas, D. (2016). Pathogenesis of Staphylococcus aureus Bloodstream Infections. Annual review of pathology, 11, 343–364. https://doi.org/10.1146/annurev-pathol-012615-044351
- Wu, D., Shi, Y., Zhang, H., & Miao, C. (2023). Epigenetic mechanisms of Immune remodeling in sepsis: targeting histone modification. Cell death & disease, 14(2), 112. https://doi.org/10.1038/s41419-023-05656-9
- Xie, J., Xu, Y., Chen, H., Chi, M., He, J., Li, M., Liu, H., Xia, J., Guan, Q., Guo, Z., & Yan, H. (2020). Identification of population-level differentially expressed genes in one-phenotype data. Bioinformatics (Oxford, England), 36(15), 4283–4290. https://doi.org/10.1093/bioinformatics/btaa523

