Using Bioinformatics to Study the Change in Gene Expression During Eye Infections Caused by Bacteria

ABSTRACT
Eye complications have always been a problem in the healthcare field. The biggest of these complications has been eye infections. However as bacteria starts to build up antibiotic resistance, old treatments will one day stop working. Therefore, along with the continued use of antibiotic treatment, new solutions can be created to target the genes that are being affected by eye infections so that the genes are being expressed normally. However, there is a lack of research on what genes should be targeted. Due to this research gap, this research study was focused on identifying genes that are regulated differently between a cornea with bacterial eye infection and normal cornea. This was done using multiple bioinformatics tools and databases such as GEO, NCBI, SR Plot, GO and KEGG to visualize, identify and analyze these genes that are being differentially expressed. Results show that the genes with the label Rac, CXCL5, MMP5, and IL1β are all differentially expressed between the normal and infected cornea. Additionally all these genes are associated with the immune system and immune response. Therefore, these 4 genes are potential biomarkers and that can help contribute to the creation of solutions and treatment that will be effective against eye infections.
KEY WORDS: Bacterial eye infections, Gene expression, Bioinformatics, GEO, NCBI, SR Plot, GO, KEGG
INTRODUCTION
Currently there are many eye complications that many people experience due to bacteria (Watson et al, 2018). These include eye infections such as Conjunctivitis, Keratitis, Endophthalmitis (Holland, 2017). No matter what the severity or pain associated with each eye infection, one thing that they have in common is that they can occur from bacterial infection (Holland, 2017).
Bacteria are prokaryotic microorganisms that are able to survive at many places around the world. Some bacteria are good and do well for the earth and help humans, however there are also bacteria that can cause harm. Due to this bacteria has a large impact on public health (Doron, 2008). Bacteria are transmitted to humans through air, water, food, or living vectors. The principal modes of transmission of bacterial infection are contact, airborne, droplet, vectors, and vehicular. Doron, 2008). Due to its ability to be transferred easily in humans bacteria are able to get into the eye leading to eye infections. Additionally one of the places that are most vulnerable to these bacterial infections is Africa. The main bacterial eye infection found in Africa is Trachoma. Trachoma is a bacterial infection that affects the eyes and is caused by the bacterium Chlamydia trachomatis (Ferede et al., 2021). More specifically Africa is the most affected continent with 27.8 million people with Trachoma. Nearly 50% of the global burden of active trachoma is highly distributed in three countries: Ethiopia, Malawi, and Nigeria which are all a part of Africa (Ferede et al., 2021).
In addition to eye infections in Africa, bacterial eye infections rates are increasing all over the world. Therefore, there is a great need to investigate how to slow down these bacterial infections that have risen. One way to investigate solutions to these bacterial eye infections is studying gene regulation during a bacterial eye infection. Studying gene regulation during bacterial eye infection has been used before and has been effective at identifying gene regulated differences between an infected and non infected eye. (Diehn et al., 2005). However, a challenge of studying gene expression in the eye is the technical obstacles associated with extracting sufficient quantities of high quality RNA from the tissues. Due to this, not every eye infection’s effect on gene regulation has been studied (Diehn et al., 2005).
Therefore, to fill this gap, the goal of this research was to understand how gene regulation changes between each eye infection. Also, the goal of this research was to identify and uncover how differences in gene expression can be used to create more solutions to combat eye infection.
The question this research study asks is, how does gene regulation change in an organism after having an eye infection due to bacteria? More specifically, are genes upregulated (highly expressed) or downregulated due to eye infections? I hypothesized that there will be differences in gene expression in each eye infection and that gene expression does not always go down or up during an eye infection. Results from this study can be used by scientists to create more solutions to combat eye infections.
METHODS
Gene Expression Microarray Data Collection
To investigate the question of gene expression during an eye infection caused by bacteria, this research utilized bioinformatics tools and databases. One of these databases is Gene Expression Omnibus (GEO). GEO is a database in NCBI that contains high-throughput molecular data, primarily focused on gene expression generated by DNA microarray technology (Barrett & Edgar, 2006). NCBI is an online resource that facilitates the use of databases and software and performs research on advanced methods of computer-based information processing for analyzing the structure and function of biologically important molecules. It is a popular database and used frequently by many researchers and scientists (Wojtkiewicz et al., 2016). However, as both NCBI and GEO focus on biological data, GEO is a part of NCBI and is focused more on experiments between two groups (Clough & Barret, 2016) by using pre-program AI and ML algorithms in the R programming language (Supplementary Data: R script for Dataset GSE58291). GEO stores a billion individual gene expression measurements, collected from over 100 organisms, submitted by over 1500 laboratories, addressing a wide range of biological phenomena (Barrett & Edgar, 2006).
In order to utilize GEO, keywords were used in order to find databases related to gene expression during eye infections caused by bacteria. These keywords include: Eye, Bacteria, Retina, Keratitis, conjunctivitis. From the use of the keywords, GEO was able to analyze and find microarray datasets that highlight bacteria’s effect on gene regulation during eye infections. From here the GSE58291 was discovered. Pathways involved in the pathophysiology of this disease were studied in the experiment by comparing the human transcriptome profile of tissue from culture-proven bacterial and fungal keratitis (n=7 and n=8 respectively) with normal non-infected cadaveric corneal tissue (C, n=12) using Illumina HT12 v4 microarrays (Chidambaram et al., 2017).
Analyzing Difference in Gene Expression using GEO2R Bioinformatics Tool
GEO2R allows users to identify and visualize differential gene expression based on the R- based GEO data analysis. It is a part of GEO and highlights genes that show significant differences in expression between two groups. It uses R programming language algorithms and includes a number of statistical categories, such as P-values, t-statistics, fold change, and gene annotations in order to highlight differences in gene expression (Sofi et al. 2022). The R programming script used to generate the data in this research can be found here: R script for Dataset GSE58291
Based on the GEO2R analysis of the GSE58291 dataset , the genes with the most significant gene expression difference were displayed as differentially expressed genes (DEGs). DEGs are genes that show significant changes in their activity levels under different experimental conditions (Anjum et al., 2016). These conditions can include different tissues, treatments, diseases, stages of development, or environmental factors (Anjum et al., 2016). A gene expression was considered significant if the P value was less than 0.05. From here the top 20 upregulated expressed genes and 20 down regulated expressed genes were chosen (Supplementary Data: Top 20 Downregulated and Upregulated Genes) for further analysis.
Investigating Potential Functions and Biological Pathways of the identified Differentially Expressed Genes Using SR Plot Bioinformatics Tool
The chosen 20 upregulated expressed genes and 20 down regulated expressed genes were further analyzed using a bioinformatics tool called SRplot (http://www.bioinformatics.com.cn/srplot). SRplot is used to visualize multiple types of biological and molecular components that occur in many different types of organisms (Tang et al., 2023). SRplot is able to do this by carrying out Gene Ontology (GO) and Kyoto Encyclopedia of Genes and Genomes (KEGG) pathway enrichment analysis. GO works by visualizing many processes by creating graphs and other visualizations. These processes include biological process (BP), cellular component (CC), and molecular function (MF) (Zhang et al., 2014). BP highlights many cellular functions that are necessary to normal behavior. CC highlights and analyzes the various components of the cell and how they play a part in a location of a gene. Lastly MF focuses on activity at the molecular level such as structural molecular activity (Zhang et al., 2014)
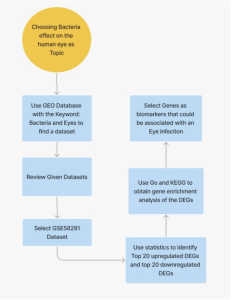
Figure 1: Method Workflow. The use of Bioinformatic tools and databases namely, GEO2r, SRplot, GO, and KEGG were used. A total of 40 differentially expressed genes (DEGs) were analyzed.
RESULTS
Identification of Differentially Expressed Genes
Differentially expressed genes (DEGs) are genes that are different expressed between two experimental conditions (Anjum et al, 2016). In this study, the DEGs that were analyzed were 20 upregulated genes and 20 down regulated genes. The DEGs were obtained from infected cornea. In order for a DEG to be identified, there needs to be a statistical significant difference or change in read counts or expression levels between the two experimental conditions. (Anjum et al., 2016).These DEGs and their expression levels can be studied under different environments, conditions, treatments, and stages for further analysis and interpretation(Anjum et al., 2016). Additionally these DEGs can be up-regulated (exhibiting increased expression) or down-regulated (exhibiting decreased expression) between two experimental groups. Identifying DEGs is important in gene expression analysis. It provides valuable insights into the molecular mechanisms that eventually lead to many biological processes and conditions (Anjum et al., 2016).
In this study, the DEG’s were obtained by a study done by Tien et al (2019) by using GEO2R (A part of NCBI (https://www.ncbi.nlm.nih.gov/geo/)) to analyze the dataset of the study: GSE58291 dataset. The study contains two experimental groups and a control group. One experimental group had the cornea with a bacteria infection, while the other experimental group had the cornea with a fungal infection. The control group had a healthy, non-infected cornea. Due to the fact that the study focuses on the difference in gene expression due to presence of bacteria or not, only the control and the experimental group that had a bacterial infection were selected for the study. The two groups were compared and the DEG’s were identified (Figure 2).
Figure 2a is a volcano plot that shows genes that were upregulated and downregulated when the experimental group that contained a bacterial infection was compared to the control group. The upregulated genes are the red dots on the plot, the downregulated genes are the blue dots on the plot, and the genes that show no statistical significant evidence in change of gene regulation are the black dots. In order for a gene to have statistical significant evidence of change in gene regulation the p-value of the change in gene regulation between the 2 groups has to be less than 0.05. Figure 2b shows all total genes that were analyzed by GEO2R. The number inside the green oval highlights the genes that show significant difference in expression between the control group and the experimental group that contains a bacterial infection. Figure 3 shows a UMAP plot. This plot shows how each group differentiates from each other in regards of approximation and projection.
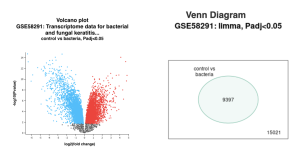
Figure 2: Difference in Gene expression between a control and bacteria experimental group. (a) Volcano plot of the genes between control group and bacteria experimental: Red dots represent genes that were upregulated, while blue dots represent genes that were downregulated. Black represents no significant difference in gene expression between control and bacterial infected groups. (b) Venn Diagram showing the total number of genes identified in this study (15021) when comparing between the control group versus bacteria experimental group (9397).
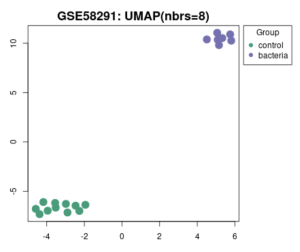
Figure 3: Association between different samples. How samples in the control group and samples of the bacterial experimental group align with other groups using the UMAP plot.
Using SRplot Bioinformatics Tool to Analyze DEGs
Using SRplot (http://www.bioinformatics.com.cn/srplot) the 20 upregulated and downregulated genes that had been selected were analyzed. This is due to the KEGG pathway enrichment analysis and GO function. Figure 4 and 5 were obtained through KEGG. Figure 4 highlights a Chemokine Signaling Pathway that was obtained from KEGG. Chemokine is responsible for signaling the migration of cells, specifically white blood cells which help with an immune response (Hughes & Nibbs, 2018).
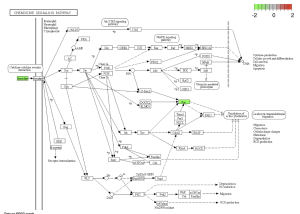
Figure 4: Chemokine Signaling Pathway. Green boxes represent areas and genes that are down regulated.
Results in figure 5 highlight an IL-17 Pathway. This Pathway is a key component in the immune system, inflammation, and T cell activation (Zenobia & Hajishengallis,2016). Figure 6 was obtained through the GO Analysis. The shows three ontologies and the respective enrichment score. The orange bars represent Biological Processes (BP) such as neutrophil chemotaxis and neutrophil migration. The green Bar represents cellular components (CP) such as tertiary granule and tertiary granule membrane. The dark blue bars represent molecular functions (MF) such as G Protein-coupled receptor binding and receptor ligand activity.
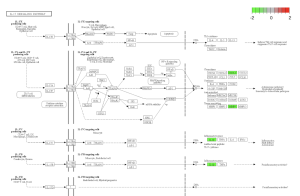
Figure 5: an IL-17 Pathway. Green boxes represent areas and genes that are down regulated.
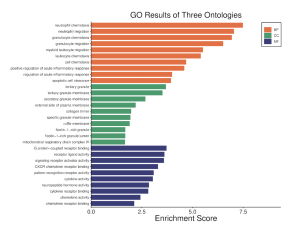
Figure 6: GO results of three Ontologies. Orange indicates biological processes (BP), Green indicates cellular components (CC), and blue indicates molecular functions (mf). As seen in the enrichment schore, the top DEGs are most enriched in the biological processes (BP) gene ontology term.
Table 1: Summary of Identified Downregulated Genes Associated with Immune System
DOWN REGULATED GENES ASSOCIATED WITH THE IMMUNE SYSTEM |
Rac |
CXCL5 |
MMP9 |
IL-1B |
DISCUSSION
Eye Infections are an ongoing problem in primary care. Most of these infections are caused by bacteria and are usually solved with antibiotic treatment (Prescr, 2018). However as more and more antibiotic treatment is used so does the chance of antibiotic resistance (Salam et al., 2023). Therefore the goal of this research study is to identify genes that are affected during an eye infection so that new solutions can target and influence the genes to act normally, leading to decrease in eye infections in people.
I Identified differentially expressed genes (DEGS) from GEO2R, which analyzed a NCBI study. Figure 2A highlights that there are many genes that are upregulated as well as downregulated. Figure 2B also highlights the difference in gene regulation by showing that 9397 genes were differentially expressed between the control group and the bacteria experimental group. Additionally GEO2R showed the UMAP plot. The UMAP plot highlights the gene similarity between groups. More specifically It highlights how the two groups in the study are different from each other but the samples in each group are similar (FIgure 3) Statistics was then used to choose the top 20 unregulated genes and top 20 downregulated genes from all the DEGs. Using the SRplot online tool, the 20 upregulated genes and 20 down regulated genes were examined through the GO and KEGG analysis. The KEGG analysis of the 40 combined DEGs showed two signaling pathways. The first signaling pathway is the Chemokine signaling pathway. The Chemokine signaling pathway is a part of the immune system and plays a part in the transportation of white blood cells (Hughes & Nibbs. 2018) KEGG highlights that the gene with the label Rac is downregulated when the cornea has a bacterial infection. (Figure 5) This downregulation of the gene indicates that the whole pathway is not occurring at the rate intended leading to decreased immune response. The second signaling pathway is the IL1β Signaling pathway. The IL1β gene is also associated with immune response and is usually transcribed to recognize pathogen-associated molecular patterns (Yin et al. 2024) KEGG highlights that the gene labeled CXCL5, MMP5, and IL1β are all differentially expressed between the normal and infected cornea. (Figure 6) Due to differences in gene regulation there is also a difference in this pathway’s ability to be involved in immune response and recognizing pathogens. Additionally GO analyzed the 40 combined DEGs. Based on GOs analysis it created a plot that highlights the association between the genes and either biological processes, cellular components, or molecular functions. Based on the graph it highlights how the 40 DEGS have the most association with biological processes due to the higher enrichment scores of the orange boxes.( Figure 7). Therefore these difference in genes cause biological processes to be altered during an eye infection.
Due to the fact that this study uses bioinformatics tools and analyzes past research studies there are some limitations. Firstly, the dataset studied in GEO2R only analyzed two types of bacteria during an eye infection. Therefore it is uncertain how genes are regulated with different types of bacteria. Therefore a future study could be analyzing different bacterial microorganisms in the eye as well as in a laboratory or clinical study instead of using a bioinformatics database.
Conclusion
Based on this research study 4 genes were indicated that potentially have association to an eye infection. These genes are Rac, CXCL5, MMP5, and IL1β, which were all downregulated. Before the research study we hypothesized there will be differences in gene expression in each eye infection and that gene expression does not always go down or up during an eye infection. I failed to reject my hypothesis based on figure 2a due to the fact that it shows that some genes were downregulated while others were upregulated. However, the genes that were associated with the pathways analyzed in KEGG were all genes that were downregulated. The findings of this study can help other healthcare professionals and other researchers to further study the relationship between gene regulation and bacterial eye infections. From here new treatment can be potentially developed in order to combat this ongoing problem of bacterial infections especially in the human eye.
SUPPLEMENTARY DATA
Supplementary Data 1: Using R Script to generate DEG results using the bioinformatics tool GEO2R
Supplementary Data 2: Google Sheet with DEGS with a P value < 0.05 and their logFC values
References
- Anjum, A., Jaggi, S., Varghese, E., Lall, S., Bhowmik, A., & Rai, A. (2016). Identification of Differentially Expressed Genes in RNA-seq Data of Arabidopsis thaliana: A Compound Distribution Approach. Journal of computational biology : a journal of computational molecular cell biology, 23(4), 239–247. https://doi.org/10.1089/cmb.2015.0205
- Barett, T., & Edgar, R. (2006, August 29). [19] gene expression omnibus: Microarray data storage, submission, retrieval, and analysis. Gene Expression Omnib us: Microarray Data Storage, Submission, Retrieval, and Analysis.
- Clough, E., & Barrett, T. (2016). The Gene Expression Omnibus Database. Methods in molecular biology (Clifton, N.J.), 1418, 93–110. https://doi.org/10.1007/978-1-4939-3578-9_5
- Chidambaram, J. D., Kannambath, S., Srikanthi, P., Shah, M., Lalitha, P., Elakkiya, S., Bauer, J., Prajna, N. V., Holland, M. J., & Burton, M. J. (2017). Persistence of Innate Immune Pathways in Late Stage Human Bacterial and Fungal Keratitis: Results from a Comparative Transcriptome Analysis. Frontiers in cellular and infection microbiology, 7, 193. https://doi.org/10.3389/fcimb.2017.00193
- Diehn, J. J., Diehn, M., Marmor, M. F., & Brown, P. O. (2005). Differential gene expression in anatomical compartments of the human eye. Genome biology, 6(9), R74. https://doi.org/10.1186/gb-2005-6-9-r74
- Doron, S., & Gorbach, S. L. (2008). Bacterial Infections: Overview. International Encyclopedia of Public Health, 273–282. https://doi.org/10.1016/B978-012373960-5.00596-7
- Ferede, A. T., Dadi, A. F., Tariku, A., & Adane, A. A. (2017). Prevalence and determinants of active trachoma among preschool-aged children in Dembia District, Northwest Ethiopia. Infectious diseases of poverty, 6(1), 128. https://doi.org/10.1186/s40249-017-0345-8
- Hughes, C. E., & Nibbs, R. J. B. (2018). A guide to chemokines and their receptors. The FEBS journal, 285(16), 2944–2971. https://doi.org/10.1111/febs.14466
- Jewell, T. (2023, February 13). Infected eye: 8 common causes. Healthline. https://www.healthline.com/health/infected-eye
- Salam, M. A., Al-Amin, M. Y., Salam, M. T., Pawar, J. S., Akhter, N., Rabaan, A. A., & Alqumber, M. A. A. (2023). Antimicrobial Resistance: A Growing Serious Threat for Global Public Health. Healthcare (Basel, Switzerland), 11(13), 1946. https://doi.org/10.3390/healthcare11131946
- Sofi, M. Y., Shafi, A., & Masoodi, K. Z. (2022). Gene expression omnibus. Chapter 9 – Plant genomic data and resources at NCBI. https://www.sciencedirect.com/science/article/abs/pii/B978032391128300019
- Tian, R., Zou, H., Wang, L., Liu, L., Song, M., & Zhang, H. (2020). Analysis of differentially expressed genes in bacterial and fungal keratitis. Indian journal of ophthalmology, 68(1), 39–46. https://doi.org/10.4103/ijo.IJO_65_19
- Watson, S., Cabrera-Aguas, M., & Khoo, P. (2018). Common eye infections. Australian prescriber, 41(3), 67–72. https://doi.org/10.18773/austprescr.2018.016
- Wojtkiewicz, M., Wiederin, J., & Ciborowski, P. (2006). National Center for Biotechnology Information. Gene Expression Omnibus: Microarray Data Storage, Submission, Retrieval, and Analysis.
- Wojtkiewicz, M., Wiederin, J., & Ciborowski, P. (2016, April 1). Proteomic database search and analytical quantification for mass spectrometry. Proteomic Profiling and Analytical Chemistry (Second Edition). https://www.sciencedirect.com/science/article/abs/pii/B9780444636881000112
- Yin, W., Godbout, J. P., & Sheridan, J. F. (2024, August 25). Interleukin-1 beta in psychosocial stress. Chapter 7 – Interleukin-1 beta in psychosocial stress. https://www.sciencedirect.com/science/article/abs/pii/B978012817558300007
- Zenobia, C., & Hajishengallis, G. (2015). Basic biology and role of interleukin-17 in immunity and inflammation. Periodontology 2000, 69(1), 142–159. https://doi.org/10.1111/prd.12083
- Zhang, J., Xing, Z., Ma, M., Wang, N., Cai, Y. D., Chen, L., & Xu, X. (2014). Gene ontology and KEGG enrichment analyses of genes related to age-related macular degeneration. BioMed research international, 2014, 450386. https://doi.org/10.1155/2014/450386

