Using Bioinformatics to Identify Differentially Expressed Genes and Pathways in ANCA-Associated Vasculitis for Improved Diagnosis and Prevention

ABSTRACT
Background
ANCA-associated vasculitis (AAV) is a group of rare autoimmune diseases that cause inflammation and destruction of small to medium-sized blood vessels, leading to multi-organ damage. AAV primarily affects the kidneys, lungs, and nervous system, with symptoms ranging from fatigue and fever to severe organ dysfunction and failure. Treatment for this disease is challenging due to its complex immunopathology. AAV presents in two biologically distinct subgroups, Endotype A and Endotype B, which differ in immune cell activity, gene expression, and treatment responses. However, the genetic pathways underlying these endotypes remain poorly understood.
Methods
This study aimed to identify differentially expressed genes (DEGs) between Endotypes A and B and to investigate their potential roles using bioinformatics tools. Gene expression data were obtained from the GEO database (GSE129752), which included blood samples from AAV patients classified by endotype. GEO2R was used to identify DEGs using p-values. Enrichment analysis was performed using SR Plot to identify Gene Ontology (GO) terms and KEGG pathways associated with the DEGs.
Results
The top 40 DEGs were narrowed down using p-value. GO analysis revealed significant enrichment in molecular functions, including microtubule motor activity, dynein intermediate chain binding, 14-3-3 protein binding, and serine-type peptidase activity. Biological process terms included peptide hormone processing and signaling receptor activity. KEGG pathway enrichment highlighted the Cell Adhesion Molecules pathway, Basal Cell Carcinoma, and Cytosolic DNA-Sensing pathways. Top genes of interest included ICOSLG, VCAM1, PVR, SLITRK4, and NEGR1.
Conclusion
These results reveal gene expression patterns and differences between AAV endotypes. The identification of key genes and enriched pathways provides new insights into AAV and reveals potential gene targets for the development of endotype-specific gene therapy.
INTRODUCTION
ANCA-associated vasculitis (AAV) is a group of rare autoimmune diseases, including granulomatosis with polyangiitis (GPA), microscopic polyangiitis (MPA), and EGPA, that cause inflammation of small‑to‑medium blood vessels in the body (1). This disease often affects the kidneys, lungs, skin, and nerves. AAV has significant morbidity and mortality; about 25% of patients die within five years of diagnosis, and many suffer organ damage or relapses despite treatment (2).
AAV presents significant challenges in both diagnosis and treatment due to its wide range of symptoms, complex immune system involvement, and similarities with other autoimmune diseases. Although patients may exhibit similar symptoms, the underlying biological processes can vary drastically between individuals (1). This makes it difficult for clinicians to predict disease progression, personalize treatments, or identify those at risk for relapse. Traditionally, AAV has been classified based on symptoms (GPA vs. MPA) and antibody type (anti-PR3 vs. anti-MPO) (2). However, these classifications often do not fully reflect the molecular and immune differences between patients. For instance, two patients with MPO-ANCA-positive vasculitis may respond very differently to the same treatment. This suggests the presence of hidden “endotypes,” which are known as biologically distinct subgroups within the same clinical diagnosis (2).
This study aims to identify distinct endotypes within AAV and how these endotypes relate to disease subtype, activity, and treatment response. While a phenotype describes what is clinically observed, such as symptoms, severity, or laboratory measurement, an endotype reveals the underlying biological processes that drive those observations (3). By uncovering how these biologically distinct subgroups work, we can better predict which patients are at higher risk of relapse, which treatments are most likely to work for different individuals, and how to develop more personalized and effective therapies for AAV, such as gene therapy. Gene therapy is a medical technique that treats or prevents disease by correcting the underlying genetic problem, typically by adding, replacing, or repairing a gene within the body’s cells. It involves delivering DNA or RNA into a cell to produce functional proteins or counteract harmful mutations (4).
AAV is primarily driven by autoantibodies known as anti-neutrophil cytoplasmic antibodies (ANCAs), which mistakenly target proteins within neutrophils, such as myeloperoxidase (MPO) and proteinase 3 (PR3). When these autoantibodies bind to their targets, they activate neutrophils, triggering a chain of inflammatory responses. This leads to blood vessel inflammation (vasculitis), which can cause tissue damage, organ dysfunction, and organ failure (1). Although current treatment strategies, such as corticosteroids and immunosuppressive medications, can effectively induce remission in many patients, relapse is common, especially during long-term maintenance therapy. AAV is clinically classified into subtypes such as GPA and MPA, which differ not only in symptoms but also in ANCA type and the organs they affect. PR3-ANCA is more often associated with involvement of the ear, nose, throat, and respiratory tract, whereas MPO-ANCA is more commonly linked to kidney-limited disease (3).
It was found that even though patients may look similar, they can have very different immune activity. In 2021, they identified two endotypes of patients. One was driven by T cells, and the other was driven by neutrophils and Toll-like receptors (2). Another study in 2023 found four molecular endotypes in AAV, each linked to different biological pathways like neutrophil activity, B cell responses, inflammation, and cell metabolism (5).
Although bioinformatics tools have helped identify different molecular endotypes in AAV, it remains unclear how these subtypes influence disease progression, treatment response, or long-term outcomes, and whether they can be used in everyday clinical practice. While we know that immune cells like neutrophils, T cells, and B cells are involved in AAV, the exact pathways behind their interactions and what triggers the immune system to attack the body are still less understood (6). These gaps make it difficult to develop more precise therapies such as gene therapy (4).
Therefore, the goal of this research is to use bioinformatics tools to analyze gene expression data from AAV patients in order to identify differentially expressed genes and uncover potential genes and pathways of AAV endotypes. It aims to explore how immune activity differs across these subgroups and how these differences relate to the disease’s development, severity, and potential response to treatment. It is hypothesized that patients with ANCA-associated vasculitis who fall into endotype A will show different gene expression patterns and immune involvement compared to patients in endotype B.
This research is important as it helps address gaps in AAV. These findings could lead to the discovery of potential new biomarkers for earlier diagnosis and more accurate predictions of which patients are likely to relapse or respond poorly to therapies. In the long term, this research could support the development of targeted treatments that are tailored to a patient’s specific immune system, reducing side effects and improving disease control.
METHODS
Data Collection and Analysis of GEO2R Data
Public gene expression datasets relevant to ANCA-associated vasculitis were retrieved from the Gene Expression Omnibus (GEO) database (8). This dataset included samples from patients diagnosed with AAV as well as healthy controls (GSE129752). To explore gene expression differences between subgroups, patient samples were categorized into endotype A, endotype B, or other, based on prior classification criteria reported in the original studies. This grouping allowed for comparison of gene expression profiles not only between AAV and controls but also among different endotypes of AAV. Differential gene expression analysis was then performed using GEO2R, an online tool offered on the GEO database (8). Figure 1 summarizes the method steps and bioinformatics tools and databases used in this study, from data collection to analysis.

Figure 1: Research Methodology- The steps and bioinformatics used in this study. Gene expression datasets were obtained from the NCBI GEO database, with differential expression assessed through the GEO2R tool, followed by functional and pathway enrichment analysis using SR Plot, incorporating Gene Ontology (GO) and KEGG pathway databases.
Identification of the Top Differentially Expressed Genes
To identify the 40 most significantly differentially expressed genes, statistical analysis was then applied. This process used p-value to prioritize the most important genes based on their differential expression.
Data Analysis Using SRPlot, KEGG, and GO Bioinformatics Tool
Then, SRPlot, KEGG, and GO bioinformatics tools and databases were used to analyze the potential functions of these genes. SR Plot is a bioinformatics tool that is used to create graphs to analyze gene pathways (9). SR Plot divides these graphs into two different results, KEGG and GO. KEGG is also a bioinformatics tool that collects and organizes information on genes and their processes (10). GO is another bioinformatics tool that organizes genes by their functions (11). Together, these tools helped uncover the potential roles of the genes and the different pathways that they might be involved in.
RESULTS
The GEO2R tool was used initially to identify differentially expressed genes between endotypes. As shown in Figure 2, many genes showed significant differences in expression between the sample groups. Some genes were found to be upregulated while others were downregulated. In the volcano plot, red dots represent significantly upregulated genes, blue dots represent significantly downregulated genes, and black dots indicate genes with no significant expression difference between the groups. The study analyzed a total of 16,280 genes across all sample groups.
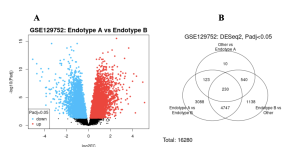
Figure 2: Differentially Expressed Genes- In the volcano plot, red dots represent significantly up-regulated genes, blue dots indicate significantly down-regulated genes, and black dots show genes with no significant expression difference between the two groups. Many genes were upregulated, although a substantial number were also downregulated. In the Venn Diagram, out of 16,280 total genes, 3,088 overlapped between Endotypes A and B, with 230 genes shared across all samples.
The genes that were downloaded from the study were narrowed down based on the p-value. The top 40 DEGS were selected by choosing those with a significance threshold of p ≤ 0.05 p-value.
To find their significance, enrichment analysis was conducted using SR Plot. This analysis helped determine the potential roles of these genes in biological pathways. KEGG pathway mapping identified several enriched pathways among the top DEGs; the Cell Adhesion Molecules pathway, the Basal Cell Carcinoma pathway, and the Cytosolic DNA-Sensing pathway were the most prominent (Figure 4a). These pathways are interconnected and involve processes like immune signaling, epithelial cell interactions, and pathogen recognition.
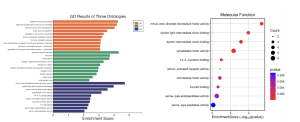
Figure 3: Gene Ontology Enrichment Analysis of DEGs- This figure presents GO enrichment results for differentially expressed genes across three ontologies. Bar plots show top enriched Biological Processes (BP), Cellular Components (CC), and Molecular Functions (MF), including peptide hormone processing, signaling receptor activity, and cell–cell adhesion. The dot plot highlights enriched molecular functions, including microtubule motor activity, dynein complex binding, and serine-type peptidase activity. Dot size indicates gene count; color represents p-value significance.
Within these pathways shown in Figure 3, several genes stood out for their repeated enrichment, including ICOSLG, PVR, VCAM1, NEGR1, SLITRK4, and NRXN3 (Figure 4b). Table 1 summarizes the key genes and pathways revealed by enrichment analysis, along with their related biological processes, signaling pathways, and possible significance in AAV disease mechanisms.
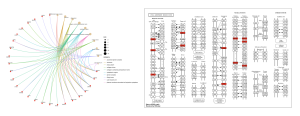
Figure 4: A. Pathway-Gene CNET Map- This network plot integrates genes with three pathways: Basal cell carcinoma (red edges), Cell adhesion molecules (green edges), and Cytosolic DNA-sensing pathway (blue edges). Larger node sizes represent higher pathway involvement. Genes ICOSLG, PVR, VCAM1, SLITRK4, and NEGR1 were recurrently enriched across multiple pathways, especially in cell adhesion and immune signaling. B. KEGG Results: Cell Adhesion Molecules Pathway– The KEGG pathway diagram for Cell Adhesion Molecules reveals the functional connections of genes involved in immune, neural, and endothelial cell interactions. Red-highlighted genes represent those most significantly enriched in the pathway. These genes are known to play critical roles in immune activation, leukocyte migration, and synaptic organization.
Table 1: Summary of Key Genes and Pathways Identified in this Study- This table shows the identified key genes and pathways identified through enrichment analysis, their associated pathways, biological functions, and potential relevance to AAV pathology.
Gene | Pathways | Function | AAV Connection |
ICOSLG | Cell Adhesion Molecules, Cytosolic DNA-Sensing | Ligand for ICOS receptor; supports T-cell activation | Promotes persistent T cell activation; may sustain inflammation in vasculitic lesions |
PVR | Cell Adhesion Molecules, Basal Cell Carcinoma | Mediates immune synapse formation and NK cell regulation | Influences leukocyte activity and vascular immune interactions |
VCAM1 | Cell Adhesion Molecules | Endothelial adhesion molecule mediates leukocyte adhesion | Highly expressed in inflamed vessels; facilitates immune cell infiltration |
SLITRK4 | Cell Adhesion Molecules | Regulates neural synapse development and signaling | May indicate neuroimmune interactions or endothelial signaling involvement |
NEGR1 | Cell Adhesion Molecules | Modulates neural growth and immune-neural communication | Suggests a role in neuroimmune signaling and potential inflammation pathways |
DISCUSSION
The primary objective of this study was to identify DEGs in ANCA-associated vasculitis using publicly available data and bioinformatics tools. Volcano plots showed many significantly upregulated and downregulated genes (Figure 2a). Venn diagram analysis revealed 3,088 genes shared between Endotypes A and B, with 230 genes common across all samples (Figure 2b). Enrichment analysis using SR Plot revealed functionally relevant pathways, including the Cell Adhesion Molecules pathway, Basal Cell Carcinoma pathway, and Cytosolic DNA-Sensing pathway (Figure 4a). Recurrently enriched genes included ICOSLG, PVR, VCAM1, NEGR1, SLITRK4, and NRXN3 (Figure 4b).
These DEGs show abnormal expression patterns that may contribute to disease progression. When comparing Endotype A and Endotype B, only a total of 3,088 DEGs were identified, showing molecular differences between these two subtypes (Figure 2a). This suggests that while both endotypes fall under the broader AAV category, they may involve distinct molecular pathways that could change treatment response (3). GO analysis categorized these DEGs under three ontologies. Among Biological Processes, peptide hormone processing, signaling receptor activity, and cell–cell adhesion via plasma membrane molecules were highly enriched (Figure 3). For Molecular Function, microtubule motor activity and dynein complex binding were significant (Figure 3). KEGG pathway analysis showed that several DEGs were involved in the Cell Adhesion Molecules pathway, which shows importance in immune and endothelial cell interactions (Figure 4a). COSLG and VCAM1 are key adhesion molecules involved in T-cell activation and leukocyte migration, which are important mechanisms in vasculitic inflammation (12). Additionally, genes such as SLITRK4 and NEGR1, which are traditionally involved in neural development, suggest the possibility of neuroimmune signaling in AAV pathophysiology (13).
Previous studies have supported the involvement of immune signaling and cell adhesion in AAV. VCAM1 has been widely reported to be upregulated in vascular inflammation and is used as a biomarker of endothelial activation (14). ICOSLG has been implicated in autoimmune diseases due to its role in sustaining T cell responses (10). PVR in NK cell activity has been noted in autoimmune and inflammatory conditions (13). The identification of SLITRK4 and NEGR1 may represent an original finding, since both have been reported to link neural and immune systems (15, 16).
The identification of key genes and pathways has the potential to impact clinical outcomes. Genes such as VCAM1 or ICOSLG (Figure 4b) could be explored as therapeutic targets to reduce inflammation in AAV patients, depending on endotypes. Drugs that inhibit endothelial adhesion or T-cell stimulation may help manage disease severity (17). Additionally, DEGs can be biomarkers for early diagnosis or patient classification, which would improve precision in autoimmune vasculitis.
Since this research utilized existing datasets, we did not generate our own samples or directly interact with patient data. As a result, the genes identified through statistical methods still need laboratory validation to confirm their role in disease progression.
These identified genes can be tested in clinical trials to determine if they play a direct role in the development of AAV. Researchers could also assess whether targeting genes like VCAM1 or ICOSLG reduces inflammation or immune activation. Future work should also explore the potential for drug development targeting enriched pathways, such as the Cell Adhesion Molecules pathway, using small-molecule inhibitors or monoclonal antibodies.
References
- Torp CK, Brüner M, Keller KK, Brouwer E, Hauge EM, McGonagle D, et al. Vasculitis therapy refines the vasculitis mechanistic classification. Autoimmun Rev [Internet]. 2021 Jun;20(6):102829. https://www.sciencedirect.com/science/article/pii/S1568997221001014
- Gill EE, Smith ML, Gibson KM, Morishita KA, Lee AHY, Falsafi R, et al. Different disease endotypes in phenotypically similar vasculitides affecting small-to-medium sized blood vessels. Front Immunol [Internet]. 2021 Feb 22;12.
- Choi H, Gao YH. Phenotypes and endotypes in bronchiectasis: a narrative review of progress toward precision medicine. J Thorac Dis. 2025;17(4):2640–2654.
- American Society of Gene & Cell Therapy. Vectors 101. Patient Education: Gene & Cell Therapy 101. ASGCT website. Published 30 Jan 2024. patienteducation.asgct.org/gene-therapy-101/vectors-101
- Engesser J, Khatri R, Schaub DP, Zhao Y, Paust HJ, Sultana Z, et al. Immune profiling-based targeting of pathogenic T cells with ustekinumab in ANCA-associated glomerulonephritis. Nat Commun [Internet]. 2024 Sep 19;15(1).
- Banos A, Thomas K, Garantziotis P, Filia A, Malissovas N, Pieta A, et al. The genomic landscape of ANCA-associated vasculitis: Distinct transcriptional signatures, molecular endotypes and comparison with systemic lupus erythematosus. Front Immunol [Internet]. 2023 Mar 27;14.
- Bayindir Y. Highlights from the breakout session: vasculitis in paediatric rheumatology Rheumatology (Oxford). 2025 [cited 2025 Jul 3];64(Suppl_1):i131.
- Barrett et al, NCBI GEO: archive for high-throughput functional genomic data. Nucleic Acids Res. 37(Database issue), D885-D890 (2019)
- Tang D, Chen M, Huang X, Zhang G, Zeng L, Zhang G, et al. SRplot: A free online platform for data visualization and graphing. PLOS ONE. 2023 Nov 9;18(11). doi:10.1371/journal.pone.0294236
- Hashimoto K, Goto S, Kawano S, Aoki-Kinoshita KF, Ueda N, Hamajima M, et al. KEGG as a glycome informatics resource. Glycobiology. 2006 May 1;16(5):63R70R.
- Ashburner M, Ball CA, Blake JA, Botstein D, Butler H, Cherry JM, et al. Gene ontology: Tool for the unification of biology. Nature Genetics. 2000 May;25(1):25–9. doi:10.1038/75556
- Hutloff A, Kassner N, Brügger B, Klein R, Reuter S, Haneke T, et al. ICOS is an inducible T-cell co-stimulator structurally and functionally related to CD28. Nature. 1999;397(6716):263–6.
- Takai Y, Ikeda W, Ogita H, Rikitake Y. Roles of nectins in the organization of intercellular junctions and cellular activities. Genes Cells. 2008;13(8):757–69.
- Pober JS, Sessa WC. Evolving functions of endothelial cells in inflammation. Nat Rev Immunol. 2007;7(10):803–15.
- Zhang Y, Xu H, Hu M, Liu X. The role of neural adhesion molecules in immune response. J Neuroimmunol. 2021;354:577531.
- Moszczynski AJ, Hinterberger G, Strong MJ, Hayley S. Neuroimmune signaling in autoimmune diseases: Emerging roles for neural growth-related genes. Front Immunol. 2019;10:753.
- Clough E, Barrett T, Wilhite SE, Ledoux P, Evangelista C, Kim I, et al. NCBI GEO: archive for gene expression and epigenomics data sets: 23-year update. Nucleic Acids Research [Internet]. 2023 Nov 2.

