Identifying Key Pathways in Late-Onset Alzheimer’s Disease using Bioinformatics

Identifying Key Pathways in Late-Onset Alzheimer’s Disease using Bioinformatics - Zachary Cruz
ABSTRACT
Background
Alzheimer’s disease is progressive brain disease that mainly impacts the elderly. Its symptoms include memory loss, impaired judgement, paranoia, and delusions. The main challenge is that there is not a known cure for Alzheimer’s disease. This research study aims to identify key differences in gene expression and to identify key pathways that are involved.
Methods
NCBI GEO2R and DAVID bioinformatics tools were used to identify differentially expressed genes and to perform enrichment in the GEO dataset GSE267613. The samples were grouped into Autosomal Dominant Alzheimer’s Disease and Healthy Control groups. DAVID was used to perform enrichment on the top genes identified.
Results
The top 50 differentially expressed genes were identified using p value and fold change. The p values were all below 0.5 and there was a mix of positive fold change values which were upregulated and negative fold change values which were downregulated. This included 33 downregulated genes and 17 upregulated genes. The GO results revealed enrichment in signalling transduction, cell surface, and lipid binding pathways. There was also a BioCarta result that revealed enrichment in fibrinolysis.
Conclusion
This study identified fibrinolysis, signalling transduction, cell surface, and lipid binding as key pathways involved in cellular communication, inflammation, and metabolism in the brain. These have all been linked to Alzheimer’s disease in previous studies. This provides insight on potential targets for the development of a cure to Alzheimer’s disease.
INTRODUCTION
Alzheimer’s Disease (AD) is currently the most common form of dementia. It is a progressive age-related disease that affects the nervous system in humans. It is most common in the elderly population since the symptoms get worse as the disease progresses. The symptoms mainly consist of loss of memory and impaired judgement (1).
Other symptoms may include paranoia, delusions, loss of social appropriateness, and worsening speaking ability or literacy (2). The type of Alzheimer’s focused on in this study is Autosomal Dominant Alzheimer’s Disease (ADAD), which is inherited dominantly through genetics. More specifically, the study is focused on late-onset Alzheimer’s Disease that affects the elderly (3).
Currently, there is not a cure for Alzheimer’s disease, so identifying genes that may affect the disease is a challenge that this research addresses in order to help find a cure (4). The main question of this research is: which genes or pathways are involved in the progression of Alzheimer’s disease between neuron samples of those with ADAD and Healthy Control (HC) samples? It is already known that Alzheimer’s disease affects the nervous system, and it is a unique disease because instead of only impacting one transmitter class of neurons, it is heterogeneous and can affect a variety of them (2). This makes it more difficult for scientists to pinpoint its effects.
To add on, bioinformatics research studies have identified four genes related to the inheritance of Alzheimer’s disease that impact protein production in the brain (2). Amyloid β-protein is one of these proteins that are affected and it has increased production with the disease. In addition, mutations can cause intramembranous cleavage of the precursor amyloid β-protein in the most harmful inherited form of the disease (2).
The most challenging thing about Alzheimer’s disease is that a cure does not exist for it (4). The main goal of this research is to identify genes or pathways present in the late onset of Alzheimer’s disease as potential targets for a cure. Our hypothesis is that there will be differences in gene expression of genes between ADAD and Healthy Control groups. This research study is important because it will potentially identify key differentially expressed genes (DEGs) and pathways that are involved in Alzheimer’s disease. This will contribute to the basis of bioinformatics data and knowledge about the disease. Eventually, this may lead to a cure for Alzheimer’s disease being discovered by the scientific community using all of the contributions to biological data collected through many research studies.
METHODS
Data Collection and Analysis of GEO2R Data
NCBI is a website that contains bioinformatics databases from various past experiments (5). Notably, this includes the Gene Expression Omnibus (GEO) dataset with gene expression data which was used in this study (5). Using the NCBI website with the Geo DataSet filter, one of the top results is GSE267613 when using the keywords Alzheimer’s disease and late onset. This was analyzed with GEO2R, a tool that performs gene expression analysis on GEO datasets through a no-code R script algorithm (5). This was done by clicking Analyze with GEO2R below the result. This dataset came from an experiment analyzing late onset Alzheimer’s disease by performing neuronal programming. 19 human neuron samples were analyzed in this dataset. The samples were grouped into 9 Autosomal Dominant Alzheimer’s Disease samples (ADAD) and 10 Healthy Control (HC) samples.
When analyzing these two groups, the GEO2R tool found 136 differentially expressed genes out of 17264 total genes, which can be seen in the Venn Diagram. This consisted of both upregulated genes which are the red dots in the volcano plot, and downregulated genes which are the blue dots in the volcano plot. The rest of the genes were not differentially expressed and they are black dots on the volcano plot. This indicates a difference in genetic expression between Alzheimer’s disease and control groups. Figure 1 shows the overview of the methodology used in this study,, outlining the steps, the bioinformatics tools, and databases utilized at each stage of the study.
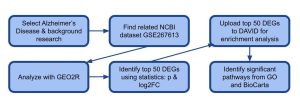
Figure 1: Research Methodology: The methodology flowchart outlines the workflow from initial data collection to functional interpretation. Gene expression datasets were obtained from the NCBI GEO bioinformatics database, and differential expression analysis was carried out using the no-code GEO2R bioinformatics tool. Key genes were further analyzed for biological functions and pathways using DAVID bioinformatics tool, which incorporates Gene Ontology (GO) and KEGG pathway databases.
Identification of the Top Differentially Expressed Genes
Statistical analysis was used to identify the top 50 most significant differentially expressed genes from this dataset. We applied a significance threshold of p ≤ 0.05 and |log2 fold change (FC)| >1 to identify the most important genes based on the level of their differential expression between the groups. The p values represent the degree of randomness in the results and a lower value indicates the results are stronger. The log2FC values indicate the difference in gene expression or gene activity regulation between the ADAD and HC groups with a positive value indicating upregulation and a negative value representing downregulation compared to the control. These genes were put in a spreadsheet by clicking Download full table on the GEO2R analysis results and pasting the results of the top 50 genes into a spreadsheet: Top 50 DEGs. They were then separated into two tables, one with all the positive log2FC values and one with all the negative log2FC values. Additionally, the total 17264 genes are in another table to show all of the genes analyzed with GEO2R that were narrowed down to 50.
Data Analysis of top DEGs Using SRPlot, KEGG, and GO Bioinformatics Tools
DAVID uses computer algorithms to analyze a list of genes and organize data into biological modules (6). The DAVID bioinformatics tool and database was used to analyze the functions of the top genes through function and enrichment analysis. The gene IDs of the top 50 DEGs from the GEO2R analysis were pasted into the DAVID bioinformatics tool and submitted after selecting Entrez Gene ID, the format of the gene IDs analyzed in this study. GO and BioCarta pathways were selected from the Annotation Summary Results. Gene Ontology (GO) is a knowledgebase that covers many genes from various organisms and analyzes their functions, gene products, and biological pathways that relate different genes and functions or products (7). Similarly, BioCarta is an online resource that also has biological pathways to display gene functions and products (8). These tools revealed the roles that these genes may play in Fibrinolysis, Signalling Transduction, Cell Surface, and Lipid binding, which may contribute to AD at a molecular level.
RESULTS
The GEO2R bioinformatics tool was used to identify the differentially expressed genes from the dataset GSE267613 selected from the NCBI website. From the results of the analysis, there were genes that were expressed differently between the ADAD and HC groups. The volcano plot visually represents the differentially expressed genes (Figure 2A). The red dots in Figure 2A represent the upregulated genes while the blue dots represent the downregulated genes that were found in the GEO2R analysis (Figure 2A). On the venn diagram in Figure 2B, it shows that the GEO2R analysis looked at a total of 17264 genes (Figure 2B). It also shows the overlapping genes between the ADAD and HC groups. These are the differentially expressed genes found from the analysis and there were a total of 136 genes (Figure 2B).
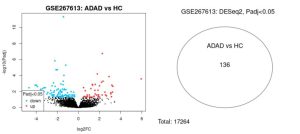
Figure 2: This volcano plot displays upregulated genes (red dots), downregulated genes (blue dots), and similarly expressed genes (black dots) when comparing ADAD and HC groups. This Venn Diagram displays the 136 DEGs between ADAD and HC groups compared to the total of 17264 genes analyzed with GEO2R.
Statistical analysis used to narrow down these genes, and it was based on the p value as well as the fold change values. These values were used to narrow down genes with a threshold of p ≤ 0.05 and |log2fc|>1. This narrowed down the differentially expressed genes from the GEO2R analysis to the top 50 DEGs. Out of these top 50 differentially expressed genes, it included a total of 33 downregulated genes and 17 upregulated genes which were separated into separate tables. These separate tables with the downregulated and upregulated genes are in a Google Sheet. On the same Google Sheet, the total 17264 genes analyzed with GEO2R were also put on a separate table that is on a different page to display the initial data that was narrowed down using statistics. Top 50 DEGs
The DAVID bioinformatics tool was used to perform enrichment in order to determine potential functions of these genes. Out of all the identified pathways, the ones that were selected were Fibrinolysis, Signalling Transduction, Cell Surface, and Lipid binding. From the GO results, Signalling Transduction, Cell Surface, and Lipid binding were identified under Biological Process (BP), Cellular Component (CC), and Molecular Function (MF) respectively. There were no KEGG pathways identified, but there was Fibrinolysis that was identified under BioCarta. These pathways indicate the potential roles that the differentially expressed genes play in cells. This can help to explain how the difference in gene expression results in impaired bodily function related to Alzheimer’s Disease.
![]()
![]()
Figure 3: Significant gene ontology term: signal transduction, where signals are converted into cellular change or processes and it can be influenced by gene expression as shown in the pathway. Black lines mean something is the next thing, blue means something is part of the next thing, and yellow means it regulates the next thing.
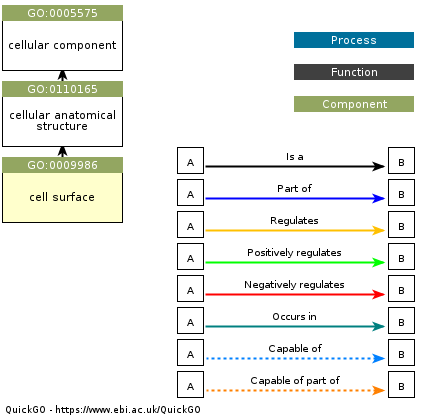
Figure 4: Significant gene ontology term: Cell surface, the outer part of the plasma membrane for brain cells. Its structure is connected to expression of genes in this pathway. The black lines mean that something is the next thing.
DISCUSSION
The main goal of this research study was to identify genes present in the late onset of Alzheimer’s disease as potential targets for a cure. GEO2R analysis of the dataset GSE267613 identified 136 differentially expressed genes out of the total 17264 analyzed between ADAD and Healthy Control groups. After selecting the top 50 most significant genes were selected, enrichment was performed using gene ontology (GO) and also BioCarta with the DAVID Bioinformatics tool. This identified pathways such as Fibrinolysis, Signalling Transduction, Cell Surface, and Lipid binding that indicate potential roles of the top DEGs.
These pathways identified by enrichment analysis may be related to Alzheimer’s disease. When the fibrinolysis process is impaired, it may cause sustained inflammation in the brain which can disrupt brain activity and contribute to AD. Impairment of signalling transduction this process may hinder the communications of brain cells, slowing down brain function, which may lead to AD. When products on the cell surface are underregulated or overregulated, cells may lose their structure, function, and communication which may lead to AD. Lastly, when binding to lipids is impaired, it may affect cellular metabolism and cellular structure in the plasma membrane which can affect AD.
Table 1: summary of key pathways identified in this study
Pathway | Relation to AD |
Fibrolysis | When this process is impaired, it may cause sustained inflammation in the brain which can disrupt brain activity and contribute to AD. |
Signalling Transduction | Impairment of this process may hinder the communications of cells to regulate processes, which may contribute to AD. |
Cell Surface | When these products are underregulated or overregulated, cells may lose their structure or dysfunction which may lead to AD. |
Lipid binding | When this binding to lipids is impaired, it may affect cellular metabolism and cellular structure in the plasma membrane which can affect AD. |
The pathways identified by enrichment generally align with previous studies on Alzheimer’s disease. For example, the impairment of fibrinolysis leads to an unhealthy accumulation of fibrinogen in the brain. This is correlated with a higher risk of AD (9). In addition, studies have found that proteins involved in signalling transduction, particularly on the cell surface, were altered in cases of Alzheimer’s disease (10). Other studies have also found relations between disruption of lipid homeostasis and Alzheimer’s Disease since the brain contains many lipids that are crucial to its function (11).
These identified pathways are significant to understanding how Alzheimer’s disease works. Further research should be done to learn more about how these pathways are actually impacted, the genes that are most significantly involved, and their relation to Alzheimer’s disease symptoms. These pathways can be potential targets to cure or treat Alzheimer’s disease in the future.
One limitation in this study is that we use bioinformatics datasets with data from past microarray experiments by other researchers. This means that the identified genes and pathways must be further studied in a laboratory before starting to develop treatment or a cure.
In the future, the identified genes and pathways should be further tested in the laboratory by scientists to determine the true impact of the genes and pathways to work towards developing a cure to Alzheimer’s Disease.
References
- Tanzi RE, Bertram L. New Frontiers in Alzheimer’s Disease Genetics. Neuron. 2001 Oct 25 https://www.cell.com/AJHG/fulltext/S0896-6273(01)00476-7
- Selkoe DJ. Alzheimer’s Disease: Genes, Proteins, and Therapy. Physiological Reviews. 2001 Apr 1 https://journals.physiology.org/doi/full/10.1152/physrev.2001.81.2.741?url_ver=Z39.88-
- Santoro A, Balbi V, Balducci E, Pirazzini C, Rosini F, Tavano F, et al. Evidence for sub-haplogroup h5 of mitochondrial DNA as a risk factor for late onset Alzheimer’s disease. PloS One. 2010 Aug 6 https://link.springer.com/article/10.1186/alzrt59
- Lopera F. What is missing: “Prevent and cure Alzheimer’s.” ScienceBank. 2024 Jan 29 https://sciencebank.com/publication/what-is-missing-prevent-and-cure-alzheimer.pdf
- Clough E, Barrett T, Wilhite SE, Ledoux P, Evangelista C, Kim I, et al. NCBI GEO: archive for gene expression and epigenomics data sets: 23-year update. Nucleic Acids Research [Internet]. 2023 Nov 2 https://academic.oup.com/nar/article/52/D1/D138/7337616
- Huang D, Sherman BT, Tan Q, Collins JR, Alvord WG, Roayaei J, et al. The DAVID Gene Functional Classification Tool: a novel biological module-centric algorithm to functionally analyze large gene lists. Genome Biology. 2007 Sep 4 https://link.springer.com/article/10.1186/gb-2007-8-9-r183
- Aleksander SA, Balhoff J, Carbon S, Cherry JM, Drabkin HJ, Ebert D, et al. The gene ontology knowledgebase in 2023. GENETICS. 2023 Mar 3 https://academic.oup.com/genetics/article/224/1/iyad031/7068118?login=false
- Nishimura D. BioCarta. Biotech Software & Internet Report. 2001 Jun https://www.liebertpub.com/doi/abs/10.1089/152791601750294344?journalCode=bsi
- Cortes-Canteli M, Paul J, Norris EH, Bronstein R, Ahn HJ, Zamolodchikov D, et al. Fibrinogen and β-Amyloid Association Alters Thrombosis and Fibrinolysis: A Possible Contributing Factor to Alzheimer’s Disease. Neuron. 2010 Jun https://www.cell.com/neuron/fulltext/S0896-6273(10)00382-X
- McShea A, Zelasko DA, Gerst JL, Smith MA. Signal transduction abnormalities in Alzheimer’s disease: evidence of a pathogenic stimuli. Brain Research. 1999 Jan https://www.sciencedirect.com/science/article/abs/pii/S0006899398011354
- Kao YC, Ho PC, Tu YK, Jou I-Ming, Tsai KJ. Lipids and Alzheimer’s Disease. International Journal of Molecular Sciences. 2020 Feb 22 https://www.mdpi.com/1422-0067/21/4/1505
- Sun Z, Kwon JS, Ren Y, Chen S, Walker CK, Lu X, et al. Modeling late-onset Alzheimer’s disease neuropathology via direct neuronal reprogramming. Science. 2024 Aug 2 https://pubmed.ncbi.nlm.nih.gov/39088624

