Identification of a Correlation of Highly Expressed Genes in Patients of Anxiety and Coronary Heart Disease using Bioinformatics

ABSTRACT
Background
Coronary heart disease develops when one’s arteries fill with plaque, causing decreased blood flow. Many people are at risk of this disease, including those of older age, those who smoke, or those with major mental health disorders. Additionally, anxiety disorders are caused by prolonged stress or worry. This research is important because coronary heart disease is the leading cause of death in the world; one study shows that it affects 126 million people globally. In addition, up to 33.7% of the population have been affected with some type of anxiety disorder in their lifetime. The goal of my research is to find genes or pathways that are common between people with both coronary heart disease and generalized anxiety disorder as potential targets for treatment.
Methods
NCBI’s bioinformatics tool, GEO2R was used to analyze two datasets, one for coronary heart disease (GSE20686) and one for generalized anxiety disorder (GSE61672). I then downloaded the full table to find the top 30 differentially expressed genes using p-value. I then used SRplot to further analyze the gene samples using GO and KEGG analysis.
Results
The results by the analysis of GEO2R showed differentially expressed genes for each of the samples; red dots represented highly expressed genes, while blue dots represented lowly expressed genes. SR Plot was used to identify statistically significant genes and pathways of each of the two datasets.
Discussion
Further research on the identified genes and pathways showed that the most significant shared genes between the two diseases included ‘DCX2’ and ‘PLCL1’ and the most significant pathways included ‘Cytokine-cytokine receptor interaction’ and ‘beta-cantenin interaction’.
INTRODUCTION
Coronary heart disease is the most common heart disease in the United States (1). In addition, heart disease is the leading cause of death in the United States (2). This shows how impactful coronary heart disease is to American health. In addition, mental health issues are also very prevalent in the United States, causing anxiety and mood disorders. For example, up to 33.7% of the population have been affected with some type of anxiety disorder in their lifetime (3).
Coronary heart disease is when one’s arteries in the heart get filled with plaque, causing decreased circulation of blood to and from the heart (1). This causes certain cardiac functions to fail, resulting in CHD which could lead to death. Anxiety disorders are common mental health issues that affect many Americans, causing heightened stress and worry (4). It is known that anxiety can lead to stress on the heart (5).
Coronary heart disease is prevalent in the U.S. and the leading cause of death (6). In addition, people experiencing mental health disorders, such as anxiety, are at risk for increased heart rate, lower blood flow in the heart, and other cardiac problems, leading to damage to the arteries (1). This means that mental health issues can lead to increased risk of coronary heart disease, causing it to pose a threat to even more people.
There are many studies about the genetic expression of coronary heart disease. For instance, there are many datasets of gene samples that are expressed in coronary heart disease (for example: GSE179789), showing how prevalent bioinformatic studies are for this disease.
It is challenging to find genetic studies about anxiety disorder because it is a mental disease, and therefore people assume that there isn’t a specific genetic cause that may lead to this. As a result, there aren’t many bioinformatic studies about anxiety disorders.
The scientific question being investigated is if there is a correlation or a gene that is highly expressed in both coronary heart disease and anxiety disorder. The goal of my research is to find genes or pathways that are common between people with both coronary heart disease and anxiety disorder as potential targets for treatment. My hypothesis is that there are genes that are highly expressed in patients of both coronary heart disease and generalized anxiety disorder.
This research is important because coronary heart disease (or ischemic heart disease) is the leading cause of death in both America and the world; one study shows that it affects 126 million people globally (6). If there was a gene that was discovered that is highly expressed in both CHD and anxiety, then this will lead to an increased understanding of both diseases.
METHODS
Data Collection and Analysis of GEO2R Data
A summary of the method steps and the bioinformatics tools and databases used in this study are summarized in Figure 1. In this study, a dataset was searched and collected from the National Center for Biotechnology Informatics (NCBI) (7) for using the keywords “coronary heart disease microarray”. A set was selected with 393 samples called “Whole Blood Cell Gene Expression Profiling in Patients with Coronary Artery Disease (Homo sapiens)” (GEO2R accession number: GSE20686).
Then the dataset was defined or categorized into groups: control, intermediate, and case; however, only control v.s. case was compared. After designation of the groups, the no-code GEO2R bioinformatics tool that uses R programming language was used to analyze the samples and produce a venn diagram and volcano plot.
Another dataset was searched for with the keywords “generalized anxiety disorder microarray” from NCBI’s database. A set was selected with 546 samples called “Blood gene expression profiles associated with symptoms of generalized anxiety disorder” (GEO2R accession number: GSE61672). This was also analyzed using GEO2R in order to produce a venn diagram and volcano plot.
Identification of the Top Differentially Expressed Genes
Then, the entire spreadsheet of all of the gene samples of the dataset was downloaded for both diseases. To identify the top 30 significant differentially expressed genes of the CHD dataset, statistical analysis was applied. This process used p-value to prioritize the most important genes based on their differential expression across samples. The same process was used to identify the top 30 significant differentially expressed genes of the GAD dataset using p-value.
Data Analysis Using SRPlot, KEGG, and GO Bioinformatics Tools
Then SRPlot bioinformatics tool and database was utilized to analyze the functions of these top genes to find statistically significant genes and pathways for both diseases. SR Plot is an online bioinformatics tool used to produce graphs and visuals showing GO and KEGG pathway analysis for any list of genes. (8). KEGG (Kyoto Encyclopedia of Genes and Genomes) analysis is defined as analysis of complex gene functions (9) while GO (Gene Ontology) analysis is an analysis of biological processes, cellular components, and molecular functions (10). Graphs produced showing GO analysis included a bar graph showing the enrichment score of the three different gene ontologies and a dot plot showing significant pathways based on p-value. Graphs produced showing KEGG analysis included a CNET plot showing genes and their associated pathways and an EMAPplot also showing significant pathways. Figure 1 presents an overview of the methods, procedures, and bioinformatics tools and databases applied throughout this study.
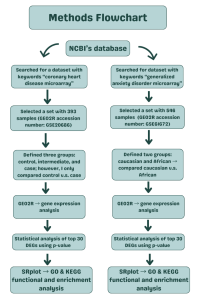
Figure 1: Research Methodology: Research method workflow adopted in this study, starting from data collection to differential gene expression analysis, and final functional and biological analysis of key genes and pathways. The bioinformatics tools and databases used at each stage were NCBI GEO for gene expression datasets, GEO2R for differential analysis and SR Plot for functional analysis via GO and KEGG bioinformatics databases.
RESULTS
Gene Expression Analysis Using GEO 2R and Statistics
We first used NCBI’S GEO2R to analyze the gene samples and identify differentially expressed genes of each dataset. There were both upregulated and downregulated genes in both of the datasets (Figure 2). In the volcano plots, red dots represent highly expressed genes, whereas the blue dots represent lowly expressed genes. The black dots represent genes that were not expressed at all (Figures 2A and 2C). The venn diagram of the coronary heart disease dataset showed that there were 9288 total genes. The venn diagram of generalized anxiety disorder showed that there were 12510 total genes. The venn diagram of the coronary heart disease dataset showed that there were 35727 differentially expressed genes that overlapped. The venn diagram of generalized anxiety disorder showed that there were 93 differentially expressed genes that overlapped (Figures 2B and 2D). To statistically narrow down the differentially expressed genes (DEGs) to identify the top 30 DEGs for both datasets, we used p-value with a cut off of <0.05 (full table of the top 30 DEGs).
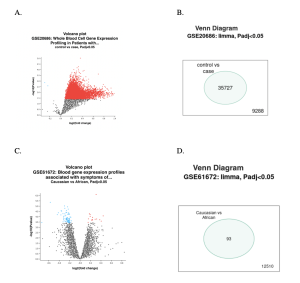
Figure 2 (A, B, D and D) Differentially Expressed Genes. Volcano plot shows genes that are expressed differently between control and case patients, while venn diagram shows the total number of genes from this study and any genes that are expressed differently between control and anxiety samples. In the volcano plots, Figures 2A and 2C, red represents up regulated genes while blue shows down regulated genes. In the venn diagrams, Figures 2B and 2D, the number on the bottom shows the number of genes that are not up/downregulated whereas the number inside the oval shows the number of up/down regulated genes.
Functional Analysis of Top DEGs using KEGG Analysis
We used the enrichment tool, SR Plot, to determine the potential functions of the genes using KEGG analysis. From the KEGG results (Figure 3C) the pathway ‘Cytokine-cytokine receptor interaction’ was identified for the CHD dataset, and the pathway ‘Nucleocytoplasmic transport’ was identified for the GAD dataset (Figure 3D). KEGG analysis also showed that the genes that stood out from the CHD dataset were ‘PPP1R17’, ‘HSPB1’, ‘DCX2’, ‘CD40’, and ‘CD27’; the genes that stood out from the GAD dataset were ‘PLCL1’, ‘PEX7’, ‘KMT2C’, ‘ID02’, ‘ATP6V1E1’, ‘NMD3’, ‘NCBP2’, and ‘XPOT’ (Figure 3A and 3B).
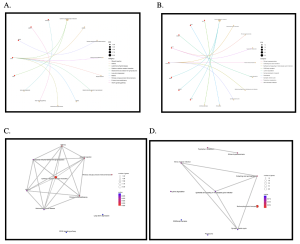
Figure 3: CNET plot showing genes and their associated pathways and EMAPplot showing pathway data:
Figure 3A shows the genes and pathways analysis of the gene samples of coronary heart disease (CHD). The most statistically significant genes are those shown in red and they are ‘PPP1R17’, ‘HSPB1’, ‘DCX2’, ‘CD40’, and ‘CD27’. Figure 3B shows the genes and pathways analysis of generalized anxiety disorder (GAD). The most statistically significant genes are those shown in red and they are ‘PLCL1’, ‘PEX7’, ‘KMT2C’, ‘ID02’, ‘ATP6V1E1’, ‘NMD3’, ‘NCBP2’, and ‘XPOT’.
In figures 3C and 3D, the most significant pathways are those indicated in red and the lines indicate their possible connection in these figures. Figure 4A shows the pathway analysis of the gene samples of coronary heart disease (CHD) based on p-value. The most significant pathway shown is ‘Cytokine-cytokine receptor interaction’. Figure 4B shows the pathway analysis of the gene samples of generalized anxiety disorder (GAD) based on p-value. The most significant pathway shown is ‘Nucleocytoplasmic transport’.
Functional Analysis of Top DEGs using GO Analysis
SR Plot bioinformatics tool was used to determine the potential functions of the top 30 genes for both the CHD and GAD dataset using Gene Ontology term analysis. For the CHD dataset, the most enriched ontology terms were under the Biological Process (BP in orange color). Specifically, the term that was most enriched was the ‘positive regulation of endothelial cell apoptotic process’ (Figure 5A). Meanwhile, under the cellular component (CC in green color) GO term, the most enriched term for our top 30 DEGs was ‘external side of plasma membrane’. Under the molecular function gene ontology term (MF in blue color), ‘beta-catenin binding’ were most enriched (Figure 5A). On the other hand, for the GAD dataset, the most enriched Biological Process GO terms from our top 30 DEGs were ‘RNA splicing via transesterification reaction with bulged adenosine as nucleophile’, ‘spliceosomal complex’under Cellular Component (CC), and ‘enzyme inhibitor activity’ under Molecular Function (MF) (Figure 5B).
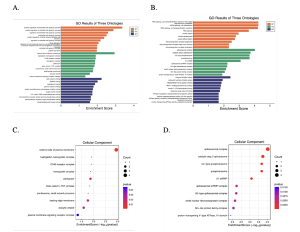
Figure 4: Enrichment score of three different gene ontologies (BP, CC, MF) and Enrichment Analysis for Cellular Component Gene Ontology:
In Figure 5A, showing the three ontologies of coronary heart disease (CHD), the enrichment score indicates that the three most prominent pathways (higher score than 2) were ‘positive regulation of endothelial cell apoptotic process’, ‘external side of plasma membrane’, and ‘beta-catenin binding’. In Figure 5B, showing the three ontologies of generalized anxiety disorder (GAD), the enrichment score indicates that the three most prominent pathways (higher score than 2) were ‘RNA splicing, via transesterification reaction with bulged adenosine as nucleophile’, ‘spliceosomal complex’, and ‘enzyme inhibitor activity’.
In Figure 5C, GO analysis was based on p-value of coronary heart disease (CHD), and the most statistically significant pathway was ‘external side of plasma membrane’. In Figure 5D, GO analysis was based on p-value of generalized anxiety disorder (GAD), and the most statistically significant pathway was ‘spliceosomal complex’.
DISCUSSION
The main goal of the research study was to find a correlation in gene samples of coronary heart disease (CHD) and generalized anxiety disorder (GAD) to find common differentially expressed genes between the two. There were two datasets being studied: one for coronary heart disease (GSE20686) and one for generalized anxiety disorder (GSE61672). As shown in Figure 2A and 2C, red dots represent highly expressed genes, and blue dots represent lowly expressed genes. The volcano plot of the coronary heart disease (CHD) data set showed a lot more differentially expressed genes (red and blue dots) than the generalized anxiety disorder (GAD) dataset (Figures 2A and 2C). There were 35727 up/downregulated genes in the CHD dataset, whereas the GAD dataset only had 93 up/downregulated genes (Figures 2B and 2D).
GO analysis showed that the statistically significant pathways of the CHD dataset were ‘positive regulation of endothelial cell apoptotic process’, ‘external side of plasma membrane’, and ‘beta-catenin binding’ (Figure 4A). A significant pathway found in the KEGG analysis was ‘cytokine-cytokine interaction (Figure 4C). In addition, statistically significant genes shown from KEGG analysis included PPP1R17, HSPB1, DCX2, CD40, and CD27 (Figure 3A). GO analysis showed that the statistically significant pathways of the GAD dataset were ‘RNA splicing, via transesterification reaction with bulged adenosine as nucleophile’, ‘spliceosomal complex’, and ‘enzyme inhibitor activity’ (Figure 4B). A significant pathway found in the KEGG analysis was ‘Nucleocytoplasmic transport’ (Figure 4D). In addition, statistically significant genes shown from KEGG analysis included ‘PLCL1’, ‘PEX7’, ‘KMT2C’, ‘ID02’, ‘ATP6V1E1’, ‘NMD3’, ‘NCBP2’, and ‘XPOT’ (Figure 3B). After researching each of the significant pathways and genes, ones that are connected directly to CHD or GAD are shown in the table below in Table 1.
Table 1: Summary of Identified Key Genes and Pathways Between CHD and GAD
| Key Genes linked to CHD | Key Pathways linked to CHD | Key Genes linked to GAD | Key Pathways linked to GAD | Overall Key Genes/Pathways that show a connection between CHD and GAD |
| DCX2 is a gene that is responsible for producing the protein, doublecortin, which plays a role in brain development (11) | Cytokine- cytokine receptor interaction is a biological process of cytokines signalling target cells in an immune reaction (12) | PLCL1 is a protein coding gene (16) | Nucleocytoplasmic transport is a biological process that regulates movement between the nucleus and cytoplasm (18) | Cytokine-cytokine receptor interaction |
| CD27 is a gene that plays an important role in the immune system (13) | External side of plasma membrane acts as a barrier/ a communication mechanism(14) | NCBP2 is a gene that binds mRNA molecules (17) | DCX2 | |
| Beta-catenin binding is a signalling Wnt pathway that regulates stability (15) | PLCL1 | |||
| Beta-catenin binding |
References
- Cubrilo-Turek M. Hypertension and Coronary Heart Disease. PubMed. 2003.
- Ahmad FB, Cisewski JA, Anderson RN. Leading Causes of Death in the US. PubMed. 2023.
- Bandelow B, Michaelis S. Epidemiology of anxiety disorders in the 21st century. Taylor & Francis. 2015.
- Craske MG, Rauch SL, Ursano R, Prenoveau J, Pine DS, Zinbarg RE. What is an anxiety disorder? FOCUS the Journal of Lifelong Learning in Psychiatry [Internet]. 2011.
- Wirtz PH, Von Känel R. Psychological stress, inflammation, and coronary heart disease. Current Cardiology Reports [Internet]. 2017.
- Khan MA, Hashim MJ, Mustafa H, Baniyas MY, Suwaidi SKBMA, AlKatheeri R, et al. Global Epidemiology of Ischemic Heart Disease: Results from the Global Burden of Disease Study. Cureus [Internet]. 2020.
- Barrett T, Troup DB, Wilhite SE, Ledoux P, Rudnev D, Evangelista C, et al. NCBI GEO: archive for high-throughput functional genomic data. Nucleic Acids Research [Internet]. 2008.
- Tang D, Chen M, Huang X, Zhang G, Zeng L, Zhang G, et al. SRplot: A free online platform for data visualization and graphing. PLoS ONE [Internet]. 2023.
- Du J, Li M, Yuan Z, Guo M, Song J, Xie X, et al. A decision analysis model for KEGG pathway analysis. BMC Bioinformatics [Internet]. 2016.
- Huntley R, Sawford T, Martin M, Donovan C. Understanding how and why the Gene Ontology and its annotations evolve: the GO within UniProt. GigaScience [Internet]. 2014.
- DCX gene: MedlinePlus Genetics [Internet].
- Turrin N, Plata-Salamán C. Cytokine–cytokine interactions and the brain.
Brain Research Bulletin [Internet]. 2000.
- Li W, Zhang F, Ju C, Lv S, Huang K. The role of CD27-CD70 signaling in myocardial infarction and cardiac remodeling. International Journal of Cardiology [Internet]. 2018.
- Dancy C, Heintzelman KE, Katt ME. The glycocalyx: the importance of sugar coating the Blood-Brain barrier. International Journal of Molecular Sciences [Internet]. 2024.
- Ni B, Sun M, Zhao J, Wang J, Cao Z. The role of β-catenin in cardiac diseases. Frontiers in Pharmacology [Internet]. 2023.
- PLCL1 phospholipase C like 1 (inactive) [Homo sapiens (human)] – Gene – NCBI [Internet].
- Naoyuki Kataoka. The Nuclear Cap-Binding Complex, a multitasking binding partner of RNA polymerase II transcripts. The Journal of Biochemistry. 2023.
- Kose S, Imamoto N. Nucleocytoplasmic transport under stress conditions and its role in HSP70 chaperone systems. Biochimica Et Biophysica Acta (BBA) – General Subjects [Internet]. 2014.
- Yamauchi‐Takihara N, Kishimoto N. Cytokines and their receptors in cardiovascular diseases — role of gp130 signalling pathway in cardiac myocyte growth and maintenance. International Journal of Experimental Pathology [Internet]. 2000.
- Bem J, Brożko N, Chakraborty C, Lipiec MA, Koziński K, Nagalski A, et al. Wnt/β‐catenin signaling in brain development and mental disorders: keeping TCF7L2 in mind. FEBS Letters [Internet]. 2019.
- De Andrade JS, Céspedes IC, Abrão RO, Santos TBD, Diniz L, Britto LRG, et al. Chronic unpredictable mild stress alters an anxiety-related defensive response, Fos immunoreactivity and hippocampal adult neurogenesis. Behavioural Brain Research [Internet]. 2013.
- Hahn J, Fu YP, Brown MR, Bis JC, De Vries PS, Feitosa MF, et al. Genetic loci associated with prevalent and incident myocardial infarction and coronary heart disease in the Cohorts for Heart and Aging Research in Genomic Epidemiology (CHARGE) Consortium. PLoS ONE [Internet]. 2020.

