Bioinformatics Identification of Gene Biomarkers of Respiratory Syncytial Virus in Respiratory Tract Infections

ABSTRACT
The topic of this research is Respiratory Syncytial Virus (RSV). This virus can cause respiratory tract infections, fevers, and breathing issues such as wheezing. RSV is difficult to diagnose due to its common symptoms with other colds and viruses. The objective of this research was to identify a unique immune response gene expression pattern during RSV infection for diagnosis.
Methods
The gene expression data was collected from a NCBI GEO dataset with accession number: GSE197364 where HEp-2 cell samples were analyzed 20 hours post RSV infection. GEO2R was used to compare groups of RSV Infected and Mock RSV Infected samples. Using the P and logFC values the top 38 DEGs were identified. The biological roles of the top 38 DEGs were identified via ShinyGO enrichment analysis.
Results
The Top 38 DEGs, identified from a list of 54,675 expressed genes, consists of the top 19 up-regulated and the top 19 down-regulated genes. The NOD-Like Receptor Signaling Pathway was identified as the most prominent KEGG pathway; AIM2, IFN-𝛃, IL-8, and GBPs were the significant genes. The prominent biological processes produced from GO enrichment analysis were “Innate immune response”, “Response to cytokine”, and “Immune response process”.
Conclusion
This study identified specific genes related to the body’s innate immune response, defense, and repair mechanism to RSV pathogens. These findings suggest NOD2, GBP5, and IFN-𝛃 expression patterns may serve as molecular biomarkers for RSV diagnosis.
INTRODUCTION
Respiratory Syncytial Virus (RSV) is a type of virus that causes severe respiratory tract infections (1). These infections can lead to great danger to the host with risk of further complications such as pneumonia (2). Untreated or severe cases of RSV can lead to higher risk of asthma development in children (1). Until recently there were currently no completely safe vaccines available for treatment or prevention of RSV (1).
RSV has been very difficult to diagnose due to similar symptoms with many other viruses and infections (3). This research hopes to solve that challenge. RSV causes at least 30 million cases of lower respiratory tract infections annually leading to over 3 million hospitalizations a year (4). It is the leading cause for hospitalizations among children under a year old (4). The most hospitalizations for infants with RSV occur at around 2.5 months of age (4). The lower respiratory tract is heavily affected by severe RSV, this includes heavy wheezing in teenage years (4). Each year RSV causes an estimated 12,000 deaths among the elderly (4). Adults can have up to 8 weeks of increased airway resistance when infected with RSV (4). The elderly and infants are most susceptible to RSV due to weakened or underdeveloped immune systems (3). It also can re-infect as the immune system is weakened.
Common methods to analyze the genes in bioinformatics studies regarding RSV mostly use host transcriptomics (5). However, there is inconsistency regarding gene expression results due to different data collection and analysis strategies and tools used by scientists (5). Small studies do not provide enough data to analyze the genes expressed by RSV. Multi-cohort samples are needed which are expensive thus difficult to conduct. Microarray results are difficult to repeat due to different platforms that are used to analyze the genes (5).
The goal of this research is to identify a gene pattern unique to RSV that is suitable for diagnosis of this disease.
My hypothesis is that specific host genes are differentially expressed in response to RSV infection and can serve as diagnostic biomarkers. This can be achieved by comparing gene expression profiles between RSV infected HEp-2 cells and mock-infected controls. Genes that are significantly up-regulated or down-regulated in infected cells may serve as molecular signatures for RSV diagnosis, enabling earlier detection and improved patient outcomes.
METHODS
Data Collection of Gene Expression Using GEO2R
A primary web-based bioinformatics tool used in the process of this research is NCBI’s GEO2R. GEO2R performs differential gene expression using no-code “R” statistical programming language (6) and was used in the collection of the data for this research. According to the study by Emily Clough et al. the GEO database is an internationally accessible tool that contains data regarding gene expression from primary research experiments available for public use in bioinformatic studies (6). The data used in this study was a GEO2R dataset with the accession number: GSE197364 collected from NCBI which was found with the GEO search filter and keywords “Respiratory Syncytial Virus Microarray”. I created two categories of sample groups, “Not Infected” to which I assigned three mock-infected control HEp-2 cell samples and “RSV Infected” to which I assigned three RSV Infected HEp-2 cell samples. The sample groups were analyzed to produce the results which were analyzed further to perform the research.
Statistical Analysis of Differentially Expressed Genes Using P Value and logFC Value
To identify the top 38 differentially expressed genes from the tens of thousands of genes that were identified within the cell samples, the measurements of p-value and logFC were used. These values were used to filter all the genes to find the top 38 DEGs in a form of statistical analysis. First, the gene data was converted into a table format and imported into google sheets. Next, genes with a p-value > 0.05 were excluded to ensure statistical significance. No specific logFC threshold was applied; instead, the genes were ranked by logFC values to identify the most dramatically up and down-regulated genes. The genes were then organized by logFC values from lowest to highest, and the top 19 most down-regulated (most negative logFC) were recorded. Next, the filtered list of genes was organized by highest to lowest logFC values, and the top 19 most up-regulated (most positive logFC) genes were recorded. These 38 genes (19 most up-regulated and 19 most down-regulated) comprise the final list of differentially expressed genes (DEGs) used for biological functional analysis.
Functional and Enrichment Analysis Using ShinyGO
ShinyGO, KEGG, and GO bioinformatics tools and databases were utilized to analyze the functions of these top genes. ShinyGO is an enrichment analysis tool where graphic visualizations can be created from enrichment results and gene characteristics with access to the KEGG and GO databases(7). The KEGG database is a bioinformatics tool/database for “systematic analysis of gene functions, linking genomic information with higher order functional information”(8). The KEGG database also includes the KEGG PATHWAY database(8). The GO database or Gene Ontology Database is also a knowledge database which contains “controlled vocabularies and classifications that cover several domains of molecular and cellular biology” and this information is freely available for the public in the use of genes and gene products and sequences annotation(9). By creating enrichment figures using the ShinyGO tool and inputting the gene IDs of the top 38 DEGs, I was able to analyze and understand the top biological processes that these genes were involved in. These tools helped uncover the potential roles of the expressed genes in response to Respiratory Syncytial Virus and how they might be potential biomarkers for RSV. Figure 1 below shows the overview of methods used and bioinformatics tools and databases utilized in this study.
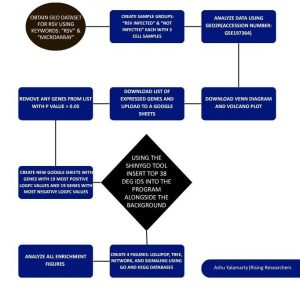
Figure 1: Research Methodology – The steps and bioinformatics used in this study. Gene expression data from NCBI GEO (GSE197364) were analyzed using GEO2R to compare three RSV-infected and three mock-infected HEp-2 cell samples. Statistical filtering by p-value and log fold change (logFC) identified the top 38 differentially expressed genes (19 upregulated, 19 downregulated). Functional enrichment analysis was performed in ShinyGO using KEGG and GO databases to determine key pathways and biological processes, revealing potential biomarkers for RSV.
RESULTS
Identification of Differentially Expressed Genes (DEGs)
The bioinformatics tool that we used to identify DEGs was NCBI’s GEO2R. Analysis of the GSE197364 data set revealed significant differences in gene expression between RSV-infected and mock-infected HEp-2 cell samples As shown in the venn diagram and volcano plot, many genes were differentially expressed between the two sample groups (Figure 2A and 2B).
Out of 54,675 genes analyzed, 4716 genes showed significant differential expression (padj <0.05) between RSV-infected and mock-infected samples (Figure 2a). In the volcano plot red dots represent significantly up-regulated genes in RSV-infected cells while blue dots represent significantly down-regulated genes, compared to mock-infected controls (Figure 2b). Black dots represent genes with no significant change between the groups (Figure 2b).
Identification of top 38 Differentially Expressed Genes(DEGs)
To focus on the gene with the greatest differential expression, we transferred the list of 54,675 genes into a google sheet document for further analysis. First, genes with a p-value > 0.05 were excluded to ensure statistical significance, narrowing the dataset to approximately 14,000 genes. By organizing the remaining genes by highest to lowest logFC values the 19 most up-regulated DEGs were identified. By repeating this process in the reverse order the 19 most downregulated genes were identified. In total, the top 38 DEGs were identified using the logFC or fold change value. This method produced 19 up-regulated genes and 19 downregulated genes represented by 19 genes with a high positive fold change value and 19 genes with a very negative fold change value. The logFC values regarding these statistically significant genes ranged from ~-8.52 to ~4.81. These identified genes can be found in this google sheets: Top 38 DEGs.
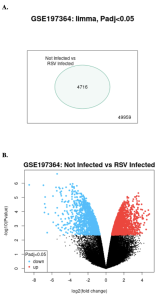
Figure 2: Identification of Differentially Expressed Genes: (A)This image shows a venn diagram that compares the produced genes from the GEO2R result with 54675 genes not expressed by both sample groups but 4716 genes expressed by both sample groups (B): This figure shows a volcano plot obtained using NCBI’s GEO2R displaying an equal amount of up and down regulated genes represented by the red and blue dots between the sample groups “Not Infected” and “RSV Infected”.
Enrichment Analysis of top 38 Differentially Expressed Genes(DEGs)
To determine the potential biological functions of the identified top DEGs I used the ShinyGO bioinformatics tool to perform enrichment analysis. As shown in Figure 3, the NOD-Like Receptor Signaling Pathway was the most prominent signaling pathway from the KEGG enrichment analysis. Further, Gene Ontology (GO) analysis showed several pathways that were most enriched among our top DEGs as shown in the GO lollipop chart showing different biological responses of the genes (Figure 4). The high enriched biological pathways included response to cytokine, inflammasome complex assemblies, immune response process, and innate immune response. The pathways that were identified from the KEGG results were the NOD-Like receptor signaling pathway, bladder cancer pathway, Rheumatoid arthritis pathway, Systolic DNA-sensing pathway, IL-17 signaling pathway, RIG-I like receptor signaling pathway, Cytokine-cytokine receptor interaction, Viral protein interaction with cytokine and cytokine receptor, TNF signaling pathway, Coronavirus disease-COVID-19, Lipid and atherosclerosis, and Chagas disease . The genes that stood out from the prominent NOD-Like receptor signaling enrichment pathway were the GBPs, IL-8, AIM2, and IFN-𝛃.
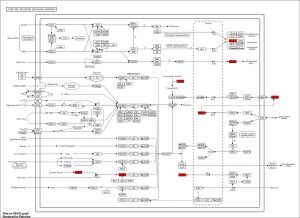
Figure 3: Enrichment KEGG Pathway from the top DEGs. Enrichment analysis revealed NOD-Like receptor signaling pathway with the significantly active genes in red boxes which include GBPs, AIM2, IFN-𝛃, and IL-8. This pathway is crucial in the immune system’s recognition and inflammatory response to infections.
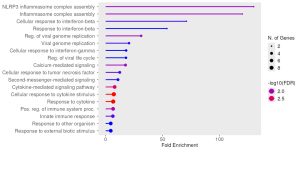 Figure 4:Enriched Biological Pathways Among the top 38 DEGs. Lollipop plot of biological processes showing significantly enriched biological processes found among the top 38 DEGs. The x-axis represents fold enrichment. The dot size represents the amount of genes involved in each process. Color intensity represents the statistical significance of the biological process. The most significantly enriched processes include Response to cytokine, inflammasome complex assemblies, and immune system processes.
DISCUSSION
Summary of Findings:
The objective of this research was to use gene expression analysis to identify potential biomarkers that could enable early RSV diagnosis by comparing gene expression of RSV-infected and mock controlled cell samples. The statistical analysis data can be found here: Top 38 DEGs. From the enrichment analysis results the most prominent pathway is the NOD-Like Receptor pathway (Figure 3). The KEGG results reveal that GBPs, IL-8, AIM2, and IFN-𝛃 are the significantly expressed genes in the NOD-Like Receptor Signaling Pathway (Figure 3). The GO lollipop plot from ShinyGO shows that there are many prominent biological processes regarding the body’s defense mechanism to infections including: inflammasome responses, response to cytokine, and innate immune response process (Figure 4).
Table 1: Summary of Significant Pathways and Genes Identified in this Study
Significant Pathways | Significant Genes | Connection to Research Goal |
NOD-Like Receptor Signaling Pathway | NOD2 | The NOD-Like Receptor Signaling Pathway is essential for RSV diagnosis as it mediates the immune response to intracellular pathogens, including RSV respiratory tract infections. NOD2, a primary component of this pathway, detects pathogen-like molecular patterns and initiates inflammatory responses. Research reveals that RSV infection up-regulates NOD2 significantly making it crucial for antiviral defense and a potential RSV diagnostic pattern. |
GBPs (GBP 5) | GBP5 is significantly downregulated during RSV infection due to viral protein-mediated degradation. Research shows that RSV G protein upregulates DZIP3, an E3 ligase which leads to GBP5 degradation. Low GBP5 levels and high DZIP3 values may potentially serve as molecular biomarkers for RSV diagnosis. | |
IFN-𝛃 | IFN-𝛃 is a type I interferon that is involved in multiple antiviral responses. Research shows significant up-regulation of IFN-𝛃 in response to RSV infection compared to other respiratory viruses making it a potential biomarker for RSV diagnosis. |
Interpretation of Results:
The 38 genes listed from the GEO2R analysis (Top 38 DEGs) are genes that are regarded as differentially expressed genes in this research experiment. This means that between the mock-infected and infected cell groups these genes were the most active or the least active during the experiment. This means that these 38 genes were either the least or most similar regarding the comparison between the two sample groups (Top 38 DEGs). Genes with little differential expression are not useful to serve as biomarkers while genes that show significant up or down-regulation represent the most promising diagnostic markers.
Since the goal of this research is related to the body’s response to respiratory tract infections from RSV, using the NOD-Like Pathway from the KEGG database produced from ShinyGO (Figure 3), we can find the highest expressed genes that are related to the body’s immune response. The most prominent pathway produced from the enrichment analysis was the NOD-Like Receptor Signaling pathway(NLR) (Figure 3). which is heavily involved in the body’s defense mechanism to infections and pathogens(10). The NLRs play a vital part in sensing molecules that are associated with intracellular infection which can include the respiratory tract infections caused by RSV(10).
The highly expressed genes produced: AIM2, IFN-𝛃, IL-8 and GBPs (Figure 3) and the prominent enrichment pathway NOD-Like receptor pathway are all part of the body’s innate immune response to sensing proteins and inflammation assembly to infections like RSV (11, 12, 13, 14, 10). AIM-2 is part of the body’s immune response but it only responds to two-stranded organisms (11). Since RSV is not a double stranded organism AIM-2 cannot be used to detect early RSV.
The NOD-Like receptor pathway and the gene ontologies provide potential biomarkers to detect early respiratory tract infections of RSV to diagnose patients with RSV and provide appropriate treatment. The prominent gene ontologies including response to cytokine, innate immune response, and immune response process are important to the goal of this study as this study is identifying a unique immune system response to RSV. The results suggest that RSV triggers a multitude of biological processes regarding the body’s antiviral immune response with specific activation of inflammasome pathways. HEp-2 cells, which are the cell samples used in this study’s data, are taken from the respiratory system and respiratory tract. Thus these results from the HEp-2 samples provide accurate data on what gene patterns would be expressed when a doctor or patient conducts a swab test of the respiratory tracts such as inside the nose.
Comparisons with Previous Studies:
The study conducted by Godkowicz and Druszcyńska reveals results shows that with RSV infection which includes the respiratory tract infections the expression NOD2 (part of the NOD-Like Receptor Signaling family) which plays a vital role in the induction of IFN-𝛃 production of cells (15). This same study shared that RSV infection increased the induction of NLRC5 an intracellular NOD-Like protein and mice that did not obtain NOD2 were at higher risk of RSV infection stating that this NOD2 is vital in antiviral immune response (15). Our identification of the NOD-like receptor signaling pathway as the most enriched pathway is supported with previous research by Dokowicz and Druszcyńska who demonstrated that RSV infection results in significant up-regulation of NOD2 expression. This consistency provides support for the hypothesis for NOD2 as a RSV biomarker.
According to the study conducted by Zhaolong Li et. al, found that the weaker the expression of GBP5 the more susceptible infants were towards being infected with RSV(16). RSV G protein has been observed to degrade expression GBP5 by upregulating other proteins including DZIP3, an E3 ligase which induces GBP5 degradation(16). Our results align with this research as GBP5 being seen as a down-regulated gene due to RSV infection as GBP5 has a negative logFC value(down-regulated) of ~-5.61 (Top 38 DEGs). These results suggest that high levels of DZIP3, an E3 ligase and low expression of GBP5 may serve as a gene pattern to diagnose RSV.
To ensure that the significant genes expressed are a pattern unique to RSV, these genes must be compared to other viruses or infections to see if they are more noticeable in RSV than other viruses such as Influenza A. According to the study by Maciej Czerkies et. al RSV induces a higher level of IFN-𝛃 compared to Influenza A as IFN-𝛃 is a main inducer of the body’s antiviral state when infected with RSV(17). The previous studies and the results from this research show similar results as RSV upregulates certain intracellular molecules compared to other microorganisms which can be used to create a gene expression pattern unique to RSV for diagnosis.
Finally to understand differences in expression levels of IL-8 from RSV infection and respiratory infections, the study by Welliver et. al was studied which revealed that Influenza A and RSV showed the same significantly high expression of IL-8(18). This suggests that IL-8 is not extremely useful in identifying a gene pattern for RSV diagnosis as it does not show a difference in expression with Influenza. This would make it difficult for doctors to understand if the expressed genes were in response to an Influenza or RSV infection and could lead to an incorrect diagnosis.
Our results and the previous studies support the hypothesis that NOD2, GBP5, and IFN-𝛃 represent promising biomarkers. This study provides a foundation for future clinical validation studies. The consistency of findings similar to ours suggests that these biomarkers may be reliable enough for clinical applications.
Implications:
These biomarkers can potentially be incorporated into rapid point of care tests reducing the average time for diagnosis from 24+ hours to minutes. Gene expression based diagnostics also hold the potential to reveal severity of infection aiding in triaging the patients more effectively. Improved RSV diagnosis could reduce inappropriate antibiotic use and support more targeted infection control measures.
Limitations:
In this research, I used bioinformatics datasets that were derived from microarray experiments conducted by other researchers. The identified genes and pathway will have to be studied to a greater extent in a clinical environment before being used to diagnose RSV. As previously mentioned, research data regarding RSV is highly inconsistent due to use of different data collection and analysis methods. The analysis was based on 3 samples per group which limits statistical power.
Future Directions:
The identified biomarkers should be validated using RNA-sequencing in larger and more diverse sample sets that can include respiratory epithelial cells and diverse patient samples with different age groups and infection severity. Clinical trials should be conducted to test the diagnostic accuracy and speed of these biomarkers compared to current diagnostic methods in all types of RSV infection severity
References
Respiratory syncytial virus–a comprehensive review. Andrea T Borchers, Christopher Chang, M Eric Gershwin, Laurel J Gershwin. Clin Rev Allergy Immunol. 2013 Dec;45(3):331-79. https://pubmed.ncbi.nlm.nih.gov/23575961/
Seesandra V. Rajagopala, Harinder Singh, Mira C. Patel, Wei Wang, Yi Tan, Megan H. Shilts, Tina V. Hartet, Marina S. Boukhalova, Jorge C. G. Blanco, & Suman R. Das. Cotton rat lung transcription reveals host immune response to Respiratory Syncytial Virus. Scientific Reports. Sci Rep 8, 11318 (2018). https://www.nature.com/articles/s41598-018-29374-x#citeas
Clarissa M. Koch, Andrew D. Prigge, Leah Setar, Kishore R. Anekalla, Hahn Chi Do-Umehara, Hiam Abdala-Valencia, Yuliya Politanska, Avani Shukla, Jairo Chavez, Grant R. Hahn, Bria M. Coates. Cilia-related gene signature in the nasal mucosa correlates with disease severity and outcomes in critical respiratory syncytial virus bronchiolitis. Front. Immunology Volume 13 – 2022. https://www.frontiersin.org/journals/immunology/articles/10.3389/fimmu.2022.924792/full
Biological Challenges and Technological Opportunities for Respiratory Syncytial Virus Vaccine Development. Barney S Graham. Immunol Rev. 2011 Jan;239(1):149–166. https://pmc.ncbi.nlm.nih.gov/articles/PMC3023887/#S1
Meta-Analysis of Whole Blood Transcriptome Datasets Characterizes the Immune Response of Respiratory Syncytial Virus Infection in Children. Qianyu Feng, Shujin Lin, Huifang Liu, Bin Yang, Lifen Han, Xiao Han, Lili Xu, Zhengde Xie. Front Cell Infect Microbiol. 12:878430 2022. https://pmc.ncbi.nlm.nih.gov/articles/PMC9043598/
NCBI GEO: archive for gene expression and epigenomics data sets: 23-year update. Emily Clough, Tanya Barrett, Stephen E Wilhite, Pierre Ledoux, Carlos Evangelista, Irene F Kim, Maxim Tomashevsky, Kimberly A Marshall, Katherine H Phillippy, Patti M Sherman, Hyeseung Lee, Naigong Zhang, Nadezhda Serova, Lukas Wagner, Vadmin Zalunin, Andrey Kochergin, Alexandra Soboleva. Nucleic Acids Res. 2023 Nov 2;52(D1):D138–D144.
ShinyGO: a graphical gene-set enrichment tool for animals and plants. Steven Xijin Ge, Dongmin Jung, Runan Yao. Bioinformatics. 2020 Apr 15;36(8):2628-2629. https://pubmed.ncbi.nlm.nih.gov/31882993/
KEGG: Kyoto Encyclopedia of Genes and Genomes. Minoru Kanehisa, Susumu Goto. Nucleic Acids Res. 2000 Jan 1;28(1):27–30. https://pmc.ncbi.nlm.nih.gov/articles/PMC102409/
The Gene Ontology database and informatics resource. GO Consortium. Nucleic Acids Res. 2004 Jan 1;32(Database issue):D258–D261 https://pmc.ncbi.nlm.nih.gov/articles/PMC308770/
The Role of Nod-Like receptors in innate immunity. Cássio Luiz Coutinho Almeida-da-Silva, Luiz Eduardo Baggio Savio, Robson Coutinho-Silva, David M Ojcius. Front Immunol. 2023 Mar 15;14:1122586. https://pmc.ncbi.nlm.nih.gov/articles/PMC10050748/
Interferon-induced guanylate-binding proteins: Guardians of host defense in health and disease. Kyle Tretina, Eui-Soon Park, Agnieszka Maminska, John D Mackling. J Exp Med. 2019 Mar 4;216(3):482–500 https://pmc.ncbi.nlm.nih.gov/articles/PMC6400534/
The AIM2 Inflammasome is essential for host defense against cytosolic bacteria and DNA viruses. Vijay A K Rathinam , et. al. Nature Immunology volume 11, 395–402 (2010).
Interferon Beta: From Molecular level to Therapeutic Effects. M Haji Abdolvahab, M R K Mofrad, H Schellekens. Int Rev Cell Mol Biol. 2016:326:343-72. https://pubmed.ncbi.nlm.nih.gov/27572132/
The role of interleukin-8 in inflammation and mechanisms of regulation. M Bickel. J Periodontol. 1993 May;64(5 Suppl):456-60. https://pubmed.ncbi.nlm.nih.gov/8315568/
NOD1, NOD2, and NLRC5 Receptors in Antiviral and Antimycobacterial Immunity. Magdalena Godkowicz, Magdalena Druszcyńska, Vaccines (Basel). 2022 Sep 7;10(9):1487.
GBP5 IS an Interferon-Induced Inhibitor of Respiratory Syncytial Virus. Zhaolong Li, Xinglong Qu, Xin Liu, Chen Huan, Hong Wang, Zhilei Zhao, Xu Yang, Schucheng Hua, Wenyan Zhang. J Virol. 2020 Oct 14;94(21):e01407-20. https://pubmed.ncbi.nlm.nih.gov/32796072/
Respiratory Syncytial Virus Protects Bystander Cells against Influenza A Virus Infection by Triggering Secretion of Type I and Type III Interferons. Maciej Czerkies, Marek Kochańczyk, Zbigniew Korwek, Wiktor Prus, Tomasz Liniacki. 2022. J Virol 96:e01341-22. https://doi.org/10.1128/jvi.01341-22
Severe Human Lower Respiratory Tract Illness Caused by Respiratory Syncytial Virus and Influenza Virus Is Characterized by the Absence of Pulmonary Cytotoxic Lymphocyte Responses. Timothy P Welliver, Roberto P Garofalo, Yashoda Hosakote, Karen H Hintz, Luis Avendano, Katherine Sanchez, Luiz Velozo, Hasan Jafri, Susana Chavez-Bueno, Pearay L Ogra, LuAnn McKinney, Jennifer L Reed, Robert C Welliver. J Infect Dis. 2007 Apr 15;195(8):1126–1136. 10.1086/512615
(GEO2R Dataset)Host cell gene expression profile in Human respiratory syncytial virus (HRSV) infected HEp2 cells at 20 hours post infection. MZ M, Chen H, Tan BH, Sugrue RJ. 2022 https://www.ncbi.nlm.nih.gov/geo/query/acc.cgi?acc=GSE197364

