Bioinformatic Analysis of Differentially Expressed Genes in Thalassemia Major

Bioinformatic Analysis of Differentially Expressed Genes in Thalassemia Major - Rishi Shah
ABSTRACT
Thalassemia Major is a hereditary blood disorder that disrupts hemoglobin production, leading to severe anemia, growth delays, organ damage, and a lifelong need for blood transfusions and iron chelation. Diagnosis is often challenging, and there is a lack of reliable biomarkers to predict disease severity or progression. This study aims to identify differentially expressed genes (DEGs) and enriched biological pathways that may serve as biomarkers or therapeutic targets in Thalassemia Major.
Gene expression data were obtained from the GSE117221 dataset, comprising blood samples from healthy individuals and Thalassemia Major patients. GEO2R was used to identify DEGs, and SRPlot was employed for Gene Ontology (GO) and KEGG pathway enrichment analysis. From 1,236 identified DEGs, the top 40 (25 upregulated and 15 downregulated) were selected for functional analysis.
Enrichment analysis revealed several key biological processes involved in Thalassemia Major, including inflammation and immune regulation, metal ion homeostasis, oxidative stress and redox balance, nutrient metabolism and absorption, hemoglobin and porphyrin biosynthesis, and detoxification. Among the top DEGs, NNMT, RORA, SLC2A6, ASS1, and NUPR were identified as critical genes.
In conclusion, this study highlights NNMT, RORA, SLC2A6, and ASS1 as key contributors to the pathophysiology of Thalassemia Major. These genes are associated with oxidative stress, inflammation, and metabolic regulation, and may serve as promising biomarkers or therapeutic targets for improving diagnosis, monitoring, and personalized treatment in patients with Thalassemia Major.
INTRODUCTION
Thalassemia is a hereditary blood disorder that affects the production of hemoglobin, leading to severe anemia and requiring lifelong management. Despite decades of research, challenges remain in diagnosing, classifying, and predicting disease severity, especially in populations with genetic diversity [1,2].
Thalassemia is a group of inherited blood disorders characterized by abnormal or reduced production of hemoglobin chains: alpha or beta. It can be classified into thalassemia minor (carrier state), thalassemia intermedia, and thalassemia major (Cooley’s anemia). Thalassemia is especially common in people of Mediterranean, Middle Eastern, South Asian, and African descent [1,2].
People with thalassemia major require regular blood transfusions, iron chelation therapy, and are at risk of complications such as organ damage and growth delays. Thalassemia minor, while usually asymptomatic, poses important reproductive risks due to its genetic nature [3].
This research is important because it leverages bioinformatics to uncover hidden patterns in genetic expression, with the goal of improving diagnosis, treatment, and understanding of disease mechanisms [3].
This research addresses the question; how can bioinformatics tools such as gene expression analysis and differential gene profiling help identify biomarkers and regulatory genes involved in thalassemia, and how might these biomarkers aid in improved diagnosis and personalized treatment? Understanding thalassemia is crucial for global public health, especially in regions where it is endemic and underdiagnosed [3].
More than 200 mutations have been identified. Thalassemia impacts oxygen delivery in the body, leading to fatigue, weakness, and developmental issues. Genetic screening is available, but not all mutations correlate clearly with severity. Treatment is mostly supportive, with no universal cure (except bone marrow transplant in some cases). Gene expression studies have revealed differential regulation of genes in thalassemia patients.
Databases like GEO have been used to identify differentially expressed genes in patient samples [4]. Bioinformatics tools such as GEO2R [5], STRING, DAVID, and Cytoscape help in: identifying hub genes, predicting protein-protein interactions and mapping metabolic and signaling pathway.
The goal of this research is to analyze gene expression data from public databases using bioinformatics tools to identify differentially expressed genes and key regulatory pathways in thalassemia patients, with the aim of uncovering potential biomarkers and therapeutic targets. Gene expression profiling of thalassemia patient data will reveal distinct sets of differentially expressed genes and pathways that correlate with disease severity and could serve as biomarkers for early diagnosis or targets for therapy.
This research bridges clinical hematology and computational biology. By identifying molecular patterns associated with thalassemia, the results from this study can be used by clinicians and researchers to improve early diagnosis, understand variability in disease severity, support development of targeted therapies, and contribute to personalized medicine efforts in genetic disorders.
METHODS
Data Collection and Analysis of GEO2R Data
In this study, the dataset GSE117221 on Thalassemia was collected from NCBI GEO 2R [4,5] by using the keywords “thalassemia” and “microarray”. Then the datasets were defined or categorized into groups healthy and Thalassemia Major And analyzed using the no-code GEO2R bioinformatics tool that uses R programming language [5].
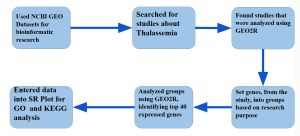
Figure 1: Research Methodology: Methodology flowchart showing the step-by-step process from data retrieval to biological interpretation. Gene expression data were sourced from the NCBI GEO database, analyzed for differential expression using the GEO2R tool, and further examined for functional and pathway enrichment using the DAVID platform, integrating GO and KEGG databases.
Identification of the Top Differentially Expressed Genes
To identify the most significant differentially expressed genes ( the top 40) for Thalassmia statistical analysis was applied. This process used p value and log fold change to prioritize the most important genes based on their differential expression across samples.
Data Analysis Using SRPlot, KEGG, and GO Bioinformatics Tools
Then SRPlot, KEGG, and GO bioinformatics tools and databases were utilized to analyze the functions of these top genes. These tools helped uncover the potential roles of the genes in Thalassemia [6].
RESULTS
Identification of Differentially Expressed Genes
The first tool used to identify differentially expressed genes (DEGs) was GEO2R [5]. Several genes were expressed differently between the healthy individuals and Thalassemia Major patients. In the volcano plot, red dots represent significantly upregulated genes, blue dots represent significantly downregulated genes, and gray dots represent genes that were not significantly differentially expressed (Figure 2A). The Venn diagram shows that a total of 1,236 DEGs were identified out of 14,165 total genes analyzed (Figure 2B). These 1,236 DEGs represent common significant genes between the two sample groups: healthy individuals and Thalassemia Major patients (Figure 2B).
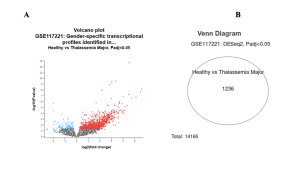
Figure 2: Identification of Differentially Expressed Genes (A) The volcano plot displays the distribution of differentially expressed genes between healthy individuals and patients with Thalassemia Major (Padj < 0.05). The x-axis shows the log2 fold change, and the y-axis represents the -log10 adjusted p-value. Red dots indicate significantly upregulated genes, blue dots represent significantly downregulated genes, and gray dots represent genes with no significant change. (B) The Venn diagram illustrates the number of significantly differentially expressed genes (DEGs) identified between healthy individuals and patients with Thalassemia Major (Padj < 0.05) from dataset GSE117221. A total of 1,236 DEGs were detected out of 14,165 total genes analyzed.
Identification of 40 Statistically Significant Differentially Expressed Genes (DEGs)
Using log2 fold change and p-value filters, a total of 40 top differentially expressed genes (DEGs) were selected based on significance ranking. Specifically the top 40 DEGs were selected using p < <0.05 as the cut off value, while the log2FC was used to split the 40 DEGs, 25 upregulated genes and 15 genes were downregulated genes. The complete list of top DEG results can be found at the following link: Top DEG Results.
To determine the potential functions of the identified genes, the SRPlot bioinformatics tool was used to conduct enrichment analyses, including Gene Ontology (GO) and KEGG pathway predictions [6]. From the KEGG results, the enriched pathways included porphyrin metabolism, mineral absorption, tight junction, protein digestion and absorption, and carbohydrate digestion and absorption (Figure 3B). Genes such as NNMT, RORA, and ASS1 stood out as they were associated with multiple enriched pathways, particularly porphyrin metabolism and mineral absorption (Figure 3A).
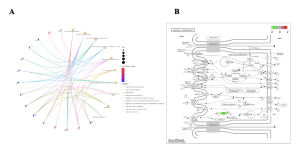
Figure 3: Identification of Key Genes and Key KEGG Biological Pathways Associated with out Top 40 DEGs. (A) KEGG CNET plot, (B) KEGG Mineral Absorption Pathway. (A) The KEGG CNET plot illustrates the relationships between enriched pathways and genes in the dataset. Each circle represents either a gene or a KEGG pathway, with colored edges indicating gene-pathway associations. Different colors correspond to distinct pathways, highlighting the multi-pathway involvement of specific genes and the functional connectivity within the biological system. (B) The KEGG map highlights enriched KEGG pathways among the DEGs, with the Mineral Absorption being most significantly overrepresented. The plot shows pathway significance based on adjusted p-values.
From the Gene Ontology (GO) results, the identified highly enriched pathways included acute inflammatory response, detoxification, regulation of carbohydrate metabolism, response to tumor necrosis factor, response to zinc ion, steroid dehydrogenase activity, oxidoreductase activity, and toxic substance binding (Figure 4A). Key genes that stood out in the GO analysis were NNMT, RORA, and SLC2A6, as they were identified in multiple GO categories, including metabolic processes and inflammation regulation (Figure 4B).
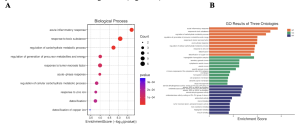
Figure 4: Identification of Highly Enriched Pathways from our Top 40 DEGs. (A) The Dot Plot shows the top enriched biological process (BP) terms identified among the differentially expressed genes. The x-axis shows the gene ratio (number of DEGs associated with the term divided by the total number of genes in that term), dot size corresponds to the number of associated genes, and color intensity reflects statistical significance (adjusted p-value). Enriched processes include immune response, apoptotic signaling, and stress response. (B) The bar plot of enriched Gene Ontology (GO) terms across Biological Process (BP), Molecular Function (MF), and Cellular Component (CC) categories. Bars represent the top enriched terms, ranked by adjusted p-value or gene count. Colors distinguish GO ontologies, enabling comparison of functional enrichment across different biological domains.
DISCUSSION
Summary of Findings:
The objective of this study was to identify differentially expressed genes (DEGs) and enriched biological functions and pathways associated with Thalassemia Major using dataset GSE117221 (Healthy vs. Thalassemia Major). Differential expression analysis via GEO2R revealed substantial transcriptional differences, shown in the volcano plot and mean-difference (MA) plot (Figure 2B). The volcano plot shows over 100 significantly upregulated genes (red) and over 50 downregulated genes (blue), with a Padj < 0.05 (Figure 2A).
Top DEGs included SLC2A6, NNMT, RORA, ASS1, and NUPR1, as highlighted in the CNET Plot in 3A.
Gene Ontology (GO) enrichment analysis identified several significant pathways across different categories. For Biological Processes, the enriched pathways included acute inflammatory response, detoxification, regulation of carbohydrate metabolic process, response to tumor necrosis factor (TNF), and response to zinc ion. In the category of Molecular Functions, oxidoreductase activity, steroid dehydrogenase activity, haptoglobin binding, and toxic substance binding were identified (Figure 4B). Under Cellular Components, the analysis highlighted the haptoglobin-hemoglobin complex, vesicle lumen, dendritic spine membrane, and blood microparticles (Figure 4B). These findings were visualized using a dot plot, which displays the top GO terms ranked by -log10(p-value) (Figure 4A), and a CNET plot, which maps specific differentially expressed genes (DEGs) to their associated enriched biological pathways (Figure 3A).
KEGG pathway analysis further revealed enrichment in several functional pathways, including porphyrin metabolism, mineral absorption, tight junction, as well as protein and carbohydrate digestion and absorption (Figure 3B).
Interpretation of Results:
The widespread differential gene expression indicates profound biological disruptions in thalassemia. Genes like NNMT, which plays a role in methylation and detoxification processes, were notably upregulated (Figure 3A). NNMT overexpression has been associated with stress-induced metabolic adaptation [11]. Similarly, SLC2A6, a glucose transporter gene, may reflect altered energy metabolism in anemic conditions [13].
The enrichment of GO biological processes such as “acute inflammatory response” and “response to tumor necrosis factor” (Figure 4A) points to ongoing immune activation in thalassemia patients. This is consistent with the chronic hemolysis and immune stimulation resulting from transfusion dependence and iron overload [7].
Detoxification of copper ion, response to zinc ion, and related molecular functions suggest metal ion dysregulation, a hallmark of iron toxicity in thalassemia [8]. Additionally, oxidoreductase and steroid dehydrogenase activity indicate redox imbalance and metabolic compensation at the cellular level [14].
The CNET plot (Figure 3A) further connects these enriched functions to genes such as RORA (a transcriptional regulator of oxidative and circadian responses), ASS1, and NNMT, emphasizing their central roles in the disease process [12].
The KEGG pathway results (Figure 3B) reinforce the findings: porphyrin metabolism is directly involved in heme biosynthesis, which is impaired in thalassemia due to defective globin chain production [9]. Enrichment in mineral absorption and tight junction pathways may represent compensatory intestinal responses to maintain iron and nutrient balance [15].
Table 1: Summary of Key Genes identified in this Study
Comparison with Previous Studies:
The findings of this study align with prior research demonstrating the role of oxidative stress, inflammation, and metabolic disruption in thalassemia [1,2,3]. Key DEGs such as NNMT, RORA, and ASS1 have been previously associated with stress response and immune regulation [4,5], supporting their relevance in disease progression.
Pathways enriched in this study, including porphyrin metabolism, mineral absorption, and inflammatory signaling (Figures 3A, 4A), have also been reported in earlier transcriptomic studies of thalassemia and related blood disorders [2,6]. These overlaps reinforce the validity of our results and highlight shared molecular mechanisms underlying thalassemia pathology.
Implications:
The identification of over 1,200 differentially expressed genes (Figure 2B) and their enrichment in key pathways, such as porphyrin metabolism, inflammatory responses, and detoxification (Figures 3B, 4B) , provides potential molecular targets for developing therapeutic interventions for Thalassemia Major. Key identified genes like NNMT, RORA, and ASS1 (Figure 3A), which are involved in oxidative stress, immune regulation, and metabolic pathways (Figures 4A, 4B), could inform the design of future targeted therapies. Furthermore, understanding these gene-pathway interactions might contribute to novel drug development, such as iron-regulation agents or inflammation modulators, and assist in biomarker discovery for earlier diagnosis or disease monitoring. These findings may also influence personalized treatment approaches, tailoring therapies based on a patient’s gene expression profile.
Limitations:
One limitation of this study is that it relies solely on publicly available bioinformatics datasets from previously published microarray experiments. As a result, the gene expression results are based on secondary data and not on samples directly collected or processed. Therefore, although the identified genes and pathways are statistically significant, they will require experimental validation in laboratory or clinical settings before being used in diagnostic tools or therapies. Additionally, we were limited by the original dataset’s sample size and demographic diversity, which may influence the generalizability of our findings to broader populations.
References
- Cao A, Galanello R. Beta-thalassemia. Genet Med. 2010 Feb;12(2):61–76.
- Higgs DR, Engel JD, Stamatoyannopoulos G. Thalassaemia. Lancet. 2012 Jan 28;379(9813):373–83.
- Weatherall DJ. The role of the inherited disorders of hemoglobin, the first “molecular diseases,” in the future of human genetics. Annu Rev Genom Hum Genet. 2012;13:249–268.
- Barrett T, Troup DB, Wilhite SE, Ledoux P, Rudnev D, Evangelista C, et al. NCBI GEO: archive for high-throughput functional genomic data. Nucleic Acids Res. 2009;37(Database issue):D885–890.
- Barrett T, Wilhite SE, Ledoux P, Evangelista C, Kim IF, Tomashevsky M, et al. NCBI GEO: archive for functional genomics data sets—update. Nucleic Acids Res. 2013 Jan;41(Database issue):D991–5.
- Tang D, Chen M, Huang X, Zhang G, Zeng L, Zhang G, et al. SRplot: a free online platform for data visualization and graphing. PLoS One. 2023;18(11):e0294236.
- Rund D, Rachmilewitz E. Beta-thalassemia. N Engl J Med. 2005 Sep 15;353(11):1135–1146.
- Cappellini MD, Musallam KM, Taher AT. Iron overload and chelation therapy in non-transfusion-dependent thalassemia. Blood Rev. 2012;26(Suppl 1):S24–29.
- Cho SY, Kim MJ, Sohn YK, Lee HJ, Kim HJ, et al. Gene expression profiles of beta-thalassemia. Br J Haematol. 2007;136(3):333–341.
- Fang X, Wang H, Han D, Xie E, Yang X, Wei J, et al. Ferroptosis as a target for protection against cardiomyopathy. Proc Natl Acad Sci U S A. 2019 Feb 12;116(7):2672–2680.
- Ulanovskaya OA, Zuhl AM, Cravatt BF. NNMT promotes epigenetic remodeling in cancer by creating a metabolic methylation sink. Nat Chem Biol. 2013 Oct;9(5):300–306.
- Takeda Y, Jothi R, Birault V, Jetten AM. RORα suppresses inflammatory responses in macrophages by negatively regulating NF-κB pathway. Proc Natl Acad Sci U S A. 2011 May 31;108(22):9576–9581.
- Musharraf SG, Nayak V, Nadeem M, Sadique S, Javed A, Khan M, et al. β-Thalassemia patients revealed a distinct plasma metabolomics profile. Sci Rep. 2017;7:42282.
- Fibach E, Dana M. Oxidative stress in β-thalassemia. Mol Diagn Ther. 2019;23(2):245–61.
- Rivella S. β-thalassemias: paradigmatic diseases for scientific discoveries and clinical progress. Blood. 2019;133(13):1279–89.

