Identification of Key Pathways and Gene Expression Changes in Uveal Melanoma Progression Using Bioinformatics

ABSTRACT
Background
Uveal melanoma is one of the most common forms of intraocular malignancy in adults, with a high risk of metastasis and poor prognosis. It occurs due to genetic and epigenetic changes that disrupt several cellular signaling pathways, including those involved in retinoid metabolism and cell adhesion. Patients have undergone vision loss and high mortality rates. Uveal melanoma presents an enormous public health challenge due to scarce therapeutic opportunities, regardless of the advances made in cancer research, remaining a poorly understood disease, especially in evaluating retinoid signaling in tumor progression. Therefore, this study aims to be useful for identifying DEGs and their associated pathways that might be targeted therapeutically.
Methods
Using the GEO2R tool from NCBI’s GEO database, we analyzed gene expression data from ATRA and 9-cisRA-treated uveal melanoma samples compared to ethanol-treated controls. Differentially expressed genes (DEGs) were identified based on adjusted p-values (p <= 0.05) and fold changes. To refine the analysis even more, an even stricter threshold of p <= 0.01 was used, which greatly decreased the number of DEGs, which could be seen in the volcano plots. Functional enrichment analysis was done using ShinyGO to look for key Gene Ontology (GO) terms and KEGG pathways linked to the DEGs. The GEO dataset (GSE149445) consisted of RNA samples collected from treated and control groups, which were separated into 48-hour 9-cisRA, 24-hour ATRA, and ethanol-treated control groups.
Results
A total of 22,576 DEGs were identified, including 3,681 downregulated genes and 30 shared genes between the two treatment comparisons. Additionally, 3 upregulated genes were unique to the 48-hour 9-cisRA vs. 24-hour 9-cisRA treatment comparison, while 18,865 genes were unique to the 24-hour ATRA vs. 24-hour Ethanol Control comparison. Enrichment analysis revealed pathways like retinoic acid catabolic process, vitamin A metabolism, and immune system regulation. The main DEGs are CYP26A1, CYP26B1, LRAT, SPP1, FOXF2, and RARB, which relate to retinoid metabolism and pathways of cell adhesion and differentiation.
Conclusion
The visible results of retinoid signaling on gene expression in uveal melanoma display the role of cell adhesion, differentiation, and immune response. This study lays the groundwork for developing potential targeted therapies to enhance treatment outcomes for uveal melanoma.
INTRODUCTION
Uveal melanoma is a rare yet aggressive form of eye cancer that develops in the middle layer of the eye, known as the uvea, which comprises the iris, ciliary body, and choroid (1). A major drawback of this form of cancer is that it can metastasize to the liver without any signs of early detection. Despite advances in medical research, the treatment options for Uveal Melanoma are limited to radiation therapy and enucleation to control the primary tumor, but even after the treatment, several patients still remain at a high risk of metastasis, leading to drastically low survival rates (2).
The primary focus of this research is to identify which genes exhibit altered expression in uveal melanoma cells following treatment with retinoid compounds, and to determine how these changes may contribute to understanding or treating the disease. Using GEO2R from the NCBI’s GEO bioinformatics database (3), the study aims to identify differentially expressed genes in response to how retinoid compounds, All-Trans Retinoic Acid (ATRA) and 9-cis-Retinoic Acid (9-cisRA), affect the overall gene expression in uveal melanoma cells. Uveal melanoma cells treated with retinoids are expected to exhibit significant changes in gene expression, with some genes being upregulated and others downregulated, particularly those that are involved in the human body’s immune response, cancer progression, and retinoid signaling pathways (4).
Researchers already know that gene expressions such as GNAQ, GNA11, and BAP1 play a significant role in tumor behavior in Uveal Melanoma cases (2)(5). Some attempts have been made to analyze the biology of the tumor through RNA sequencing and gene profiling (6); however, bioinformatics research in this area remains relatively novel. Retinoids have been shown to regulate gene expression and induce cell differentiation; however, the mechanisms by which they regulate gene function within uveal melanoma cells remain unknown. Furthermore, it remains unclear which specific genes are most responsible for the growth and spread of uveal melanoma, particularly after treatment, and which type of retinoid treatment induces changes in these genes. Uveal melanoma is known to be the most common eye cancer in adults, but it is still considered rare.
This research is a gateway to identifying new genetic markers and molecular pathways that are influenced by retinoid therapy. This will pave the way for future clinical advancements using bioinformatics and help develop more personalized and effective treatment plans for patients.
METHODS
Data Collection and Analysis of GEO2R Data
In this study, the dataset GSE149445 on Uveal Melanoma Progression was collected from NCBI GEO 2R by using the keywords “uveal melanoma”, “differential gene expression”, and “retinoid treatment”. NCBI GEO2R is an online tool that allows researchers to analyze gene expression data from the Gene Expression Omnibus (GEO) database. It assists in identifying differentially expressed genes (DEGs) between experimental conditions by applying statistical methods to calculate p-values and fold changes (3).
The datasets were then categorized into Control Groups (24h and 48h Ethanol control) and Treatment Groups (ATRA- and 9-cisRA-treated samples). And analyzed using the no-code GEO2R bioinformatics tool, which utilizes the R programming language to identify differentially expressed genes (DEGs). Figure 1 shows an overview of the research methodology, pointing out the techniques used at each step, as well as the bioinformatics tools and databases used in this study.
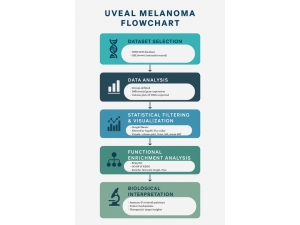
Figure 1: Research Methodology: Overall key steps in the research process, and bioinformatics tools and databases used in this study. Data collection, statistical data analysis, biological function, and enrichment analyses were part of the key steps. Various bioinformatics tools and databases were employed in the study for data collection, differential gene expression analysis, functional annotation, and pathway enrichment analysis.
Identification of the Top Differentially Expressed Genes
To identify the top 50 most significantly differentially expressed genes, statistical analysis was applied. This process used p <= 0.05 to prioritize the most important genes based on their differential expression across samples.
Data Analysis Using SRPlot, KEGG, and GO Bioinformatics Tools
Then, SRPlot, KEGG, and GO bioinformatics tools and databases were utilized to analyze the functions of these top genes. SR Plot is a web-based tool used to create statistical models, such as volcano plots and Venn diagrams, which help identify and compare differentially expressed genes (7). KEGG is defined as a system that maps genes to biological pathways (8), while GO annotates genes with biological processes, molecular functions, and cellular components (9). These tools helped uncover the potential roles of the genes in retinoid signaling pathways, immune response regulation, and tumor progression or suppression mechanisms.
RESULTS
Identification of Differentially Expressed Genes
The primary bioinformatics tool used in this study was GEO2R, a tool from NCBI’s GEO database, which was employed to identify differentially expressed genes (DEGs). Significant differences were observed in gene expression between the control groups (Ethanol control for 24 hours and 48 hours) and the treatment groups (ATRA- and 9-cisRA-treated samples) associated with variations in the up- and downregulation of certain genes depending on the treatment conditions Figure 2A. In the volcano plot, red dots represent upregulated genes with increased expression in the treatment groups, blue dots represent downregulated genes with decreased expression, and black dots represent genes with no significant changes Furthermore, the volcano plot in Figure 2A (p <= 0.05) shows a larger number of upregulated and downregulated genes compared to Figure 2B (p <= 0.001), where the stricter threshold significantly reduces the number of DEGs. The analysis based on the Venn Diagram resulted in a total of 22,576 DEGs, from which 3,681 genes were found to be specific to the 48-hour 9-cisRA treatment group, 18,865 genes to the 24-hour ATRA treatment group, and 30 genes overlapping between the two treatments Figure 2C. These 30 genes shared by 9-cisRA and ATRA may be involved in pathways common to both retinoids Figure 2C.
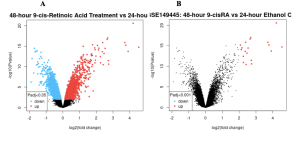
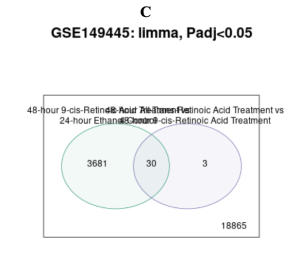
Figure 2: Differentially Expressed Genes: The volcano plots above display the distribution of gene expression changes, with significant upregulation and downregulation highlighted in red and blue dots, respectively. Although the primary threshold is p <= 0.05, setting the threshold for significance to p <= 0.001 had the result of reducing the amount of DEGs drastically, as can be observed in the right-hand volcano plot, which is plotting significantly fewer upregulated and downregulated genes at the increased threshold.
Identification of 50 Statistically Significant Differentially Expressed Genes (DEGs)
The top 50 differentially expressed genes (DEGs) were identified using p-values with p <= 0.05 for statistically significant coherence. A total of 50 DEGs were used based on the p-value. From these, key genes such as CYP26A1, RARB, SPP1, and FOXF2 were identified based on their association with critical pathways, including the retinoic acid catabolic process, positive regulation of substrate adhesion-dependent cell spreading, and positive regulation of cell development Figure 4. These pathways are essential for retinoid metabolism, cellular adhesion, and tumor progression. Additional genes, such as CYP26B1 and LRAT, were also highlighted for their roles in processes like vitamin A metabolism and cell adhesion, emphasizing the pathway-focused nature of this study Figure 4.
Potential Functions and Enrichment of the Identified Genes and Pathways
The functional enrichment analysis was conducted using ShinyGO, which provided insights into the biological processes and pathways associated with the 50 DEGs. From the KEGG results, several key pathways were identified that provide insights into the biological processes influenced by the differentially expressed genes (DEGs) Figure 4. Specifically, the Retinoic Acid Catabolic Process and Diterpenoid Catabolic Process were the most enriched pathways, each with a fold enrichment of 183, highlighting their significant role in retinoid metabolism. Additionally, pathways related to Vitamin A Metabolism (72.3) and Substrate Adhesion-Dependent Cell Spreading (16.1) were identified Figure 4B. All of these emphasize their importance in cellular processes. These findings show the involvement of retinoid signaling, vitamin metabolism, and cellular development in the response to retinoid treatments. From the KEGG results, the genes that stood out were CYP26A1, SPP1, FOXF2, RARB, CYP26B1, and LRAT, due to their correlation with the Retinoic Acid Catabolic Process (183-fold enrichment), Vitamin A Metabolism, and cell adhesion, which are critical for retinoid signaling and cancer progression Figure 4B.
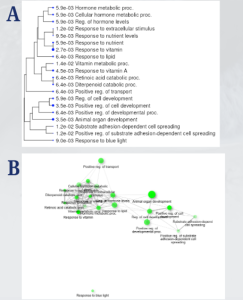
Figure 3. KEGG Pathway Network and Dendrogram of Pathway Clustering: The dendrogram (3A) categorizes pathways into related groups, such as hormone metabolism and vitamin response, indicating their shared biological functions. The KEGG network plot (3B) shows how pathways are interconnected through the shared genes, with larger green circles highlighting pathways with more significant genes. Together, these visuals illustrate how pathways function in coordination to influence critical biological processes related to uveal melanoma progression.
The GO analysis identified key pathways, including the Retinoic Acid Catabolic Process and Diterpenoid Catabolic Process, both with the highest fold enrichment of 183, as well as the Response to Blue Light (152.5) and Response to Vitamin A (72.3) Figure 4B. These pathways highlight retinoid metabolism, vitamin regulation, and light-responsive mechanisms Figure 4A. Additionally, pathways such as Positive Regulation of Cell Development (10.1) and Substrate Adhesion-Dependent Cell Spreading (16.1) highlight processes crucial to cellular growth and adhesion Figure 4B.
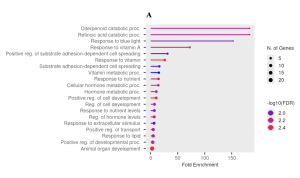
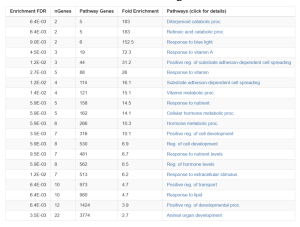
Figure 4. Pathway Representation Functional Enrichment Analysis: The bubble plot (4A) visually represents the enrichment of pathways, where bubble size corresponds to the number of genes involved, and color intensity reflects significance (-log10(FDR)). Key pathways, such as the “retinoic acid catabolic process” and “response to blue light,” show high enrichment and gene significance. The table of GO pathways (4B) summarizes these results, providing fold enrichment, the number of genes involved, and adjusted FDR values. The most enriched pathways were the diterpenoid and retinoic acid catabolic processes (183-fold enrichment), followed by responses to blue light and vitamin A-related pathways. Together, these visuals highlight pathways critical to retinoid signaling and cellular regulation.
DISCUSSION
The study identified numerous differentially expressed genes in Uveal Melanoma cells following treatment with all-trans retinoic acid (ATRA) and 9-cis retinoic acid (9-cisRA) (Figure #2). Through the use of gene ontology analysis, new findings of enrichment in biological processes were identified, including the retinoic acid catabolic process, a response to light stimulus, the Vitamin A metabolic process, and immune system regulation (Figure # 3). Furthermore, the KEGG pathway analysis revealed an overrepresentation of pathways, including retinoid signaling, cell cycle control, and metabolic pathways (Figure #4).
Interpretation of Results:
The data demonstrate that retinoid compounds induce substantial changes in the gene expression profiles of uveal melanoma cells (Figure #6). The changes are most often seen in genes that regulate apoptosis and immune responses. For instance, the enrichment observed in retinoic acid catabolic and vitamin A metabolic processes indicates enhanced activity in retinoid signaling, which is known to influence cell differentiation and inhibit tumor growth (10). The increased activity of genes involved in the immune system suggests that retinoid treatment may help the body fight the cancer (10). Changes in genes that control cell growth and cell death mean that retinoids could slow down the cancer or help kill cancer cells (4). Overall, these results demonstrate that retinoids impact key genes and pathways in uveal melanoma, suggesting new avenues for developing more effective treatments in the future.
Why Are There So Many Clusters on the Volcano Plot but Only 3 Upregulated Genes in the Venn Diagram?
The volcano plot shows all significant genes for a single comparison, including both upregulated and downregulated genes. Whereas, the Venn diagram focuses on the overlap and uniqueness of DEGs between two comparisons. The 3 upregulated genes in the Venn diagram are unique to the 48-hour 9-cisRA vs. 24-hour 9-cisRA comparison, while the volcano plot includes all significant genes for each comparison. This explains why the volcano plot displays numerous clusters of genes, whereas the Venn diagram highlights only a small subset of them.
The Venn diagram filters the DEGs to show only unique or shared genes between comparisons, while the volcano plot visualizes all significant genes for a single comparison.
How Do You Know the Left Side of the Volcano Plot Is Downregulated and Not Upregulated?
In the volcano plot, the x-axis represents log2(fold change), where negative values are on the left and indicate downregulated genes, and positive values are on the right, indicating upregulated genes. The y-axis shows -log10(p-value), with higher values indicating greater statistical significance. The left plot (p <= 0.05) highlights more significantly downregulated genes (blue) compared to upregulated genes (red), whereas the right plot (p <= 0.001) applies a stricter threshold, reducing the number of significant genes (Figure #2). These results were further refined using the Venn diagram to identify shared and unique DEGs for pathway enrichment analysis.
Importance of the Top 50 Genes from the Spreadsheet
The top 50 DEGs were selected for pathway enrichment analysis due to their significant roles in key biological processes. Among these, CYP26A1, SPP1, FOXF2, RARB, CYP26B1, and LRAT emerged as central genes associated with pathways such as retinoid metabolism, cellular adhesion, and cell differentiation, supporting the hypothesis that retinoid compounds induce significant changes in gene expression (11)(12)(13)(14)(15). These genes regulate significant processes such as the degradation of retinoic acid, tumor suppression, cell-cell interactions, and programmed cell death, making them crucial contributors to enriched pathways and probable therapeutic targets for uveal melanoma.
Comparison with Previous Studies
This study expands upon previous genomic analyses of uveal melanoma, which have identified mutations in GNAQ, GNA11, and BAP1 as drivers of anti-tumor responses (2)(5). Few studies have mentioned gene expression responses to retinoid therapy, making our findings particularly relevant. A similar upregulation of differentiation and apoptotic pathways has been described in retinoid-treated cutaneous melanoma models, suggesting shared therapeutic mechanisms (10). Some genes have already been identified as playing a role in determining the prognosis and response to treatment in individuals with melanoma (6). The results of this study suggest that these genes should be studied more closely to determine if they can help doctors predict the disease or develop new medicines. To confirm their importance, further tests in the lab and with actual patient samples will be essential to validate these findings.
Summary Table Of Selected Key Pathways
Pathway | Fold Enrichment | nGenes | Enrichment FDR | Significance |
Diterpenoid Catabolic Process | 183 | 5 | 6.4e-03 | Central to retinoid metabolism, crucial for understanding retinoid treatments. |
Retinoic Acid Catabolic Process | 183 | 5 | 6.4e-03 | Directly linked to retinoid signaling and gene regulation. |
Response to Blue Light | 152.5 | 6 | 9.0e-03 | Suggests light-responsive mechanisms influencing cellular processes. |
Response to Vitamin A | 72.3 | 3 | 4.5e-03 | Highlights the role of vitamin A in regulating gene expression. |
Positive Regulation of Substrate Adhesion-Dependent Cell Spreading | 31.2 | 3 | 1.2e-02 | Critical for cell adhesion and migration, relevant to cancer progression. |
Implications
This study has shed light on the molecular basis of uveal melanoma and its sensitivity to retinoid therapy. Some of the key pathways, including the retinoic acid catabolic pathway and immune response regulation, provide possible therapeutic targets for these diseases. These findings suggest potential avenues for developing new therapies or drugs that target these pathways to inhibit tumor growth, activate the immune response, or promote the differentiation of cancer cells. The enriched pathways involved in vitamin A metabolism and cell cycle regulation also suggest that retinoid-based therapies can be further designed to enhance their efficacy against uveal melanoma (8)(10). By ranking the most significant genes implicated, such as CYP26A1, SPP1, FOXF2, RARB, CYP26B1, and LRAT, future research can definitely explore their potential as biomarkers for disease analysis.
Limitations
While this study provides valuable insights, it has some limitations. The findings are based on publicly available datasets and bioinformatics tools, meaning that the data were not directly collected or validated through laboratory experiments. Additionally, the dataset may lack diversity in sample sources, which could diminish the broader applicability of the results to diverse populations. Due to the small sample size, the study might not be able to account for all presentations of uveal melanoma as seen in a real biological context. Furthermore, perhaps the stringent statistical thresholds overlooked some biologically relevant genes of high significance that could have shed more light on the nature of the disease, while reducing the number of false positives.
Future Directions
The identified genes, CYP26A1, SPP1, FOXF2, RARB, CYP26B1, and LRAT, can be tested in the laboratory by scientists to confirm their roles in uveal melanoma progression and response to retinoid treatments. Further research should focus on exploring enriched pathways, such as the retinoic acid catabolic process and the p53 signaling pathway, to develop targeted therapies. Additionally, these genes and pathways could serve as biomarkers for early detection and personalized treatment strategies, with in vivo studies and clinical trials needed to assess their therapeutic potential.
References
- Grisanti S, Tura A. Uveal Melanoma [Internet]. Scott JF, Gerstenblith MR, editors. PubMed. Brisbane (AU): Codon Publications; 2018. Available from: https://www.ncbi.nlm.nih.gov/books/NBK506991/
- Harbour JW, Onken MD, Roberson EDO, Duan S, Cao L, Worley LA, et al. Frequent Mutation of BAP1 in Metastasizing Uveal Melanomas. Science. 2010 Nov 4;330(6009):1410–3.
- Barrett T, Wilhite SE, Ledoux P, Evangelista C, Kim IF, Tomashevsky M, et al. NCBI GEO: archive for functional genomics data sets—update. Nucleic Acids Research. 2012 Nov 26;41(D1):D991–5. https://pubmed.ncbi.nlm.nih.gov/23193258/
- Vertuani S, Dubrovska E, Levitsky V, Jager MJ, Kiessling R, Jelena Levitskaya. Retinoic acid elicits cytostatic, cytotoxic and immunomodulatory effects on uveal melanoma cells. Cancer Immunology Immunotherapy [Internet]. 2006 Jun 2 [cited 2025 Feb 27];56(2):193–204. Available from: https://pmc.ncbi.nlm.nih.gov/articles/PMC11030064/
- Silva-Rodríguez P, Fernández-Díaz D, Bande M, Pardo M, Loidi L, Blanco-Teijeiro MJ. GNAQ and GNA11 Genes: A Comprehensive Review on Oncogenesis, Prognosis and Therapeutic Opportunities in Uveal Melanoma. Cancers [Internet]. 2022 Jun 22;14(13):3066. Available from: https://www.ncbi.nlm.nih.gov/pmc/articles/PMC9264989/
- Daniels AB, Lee JE, MacConaill LE, Emanuele Palescandolo, Paul Van Hummelen, Adams SM, et al. High Throughput Mass Spectrometry-Based Mutation Profiling of Primary Uveal Melanoma. Investigative Ophthalmology & Visual Science. 2012 Sep 15;53(11):6991–1.
- Tang D, Chen M, Huang X, Zhang G, Lin Z, Zhang G, et al. SRplot: A free online platform for data visualization and graphing. PLOS ONE. 2023 Nov 9;18(11):e0294236– https://pubmed.ncbi.nlm.nih.gov/37943830/
- Kanehisa M, Furumichi M, Sato Y, Ishiguro-Watanabe M, Tanabe M. KEGG: integrating viruses and cellular organisms. Nucleic Acids Research [Internet]. 2020 Oct 30;49(D1):D545–51. Available from: https://www.ncbi.nlm.nih.gov/pmc/articles/PMC7779016/
- Abbas MN, Broneske D, Saake G. A multi-objective evolutionary algorithm for detecting protein complexes in PPI networks using gene ontology. Scientific reports [Internet]. 2025 Autumn;15(1):16855. Available from: https://pubmed.ncbi.nlm.nih.gov/40374682/
- Estler M, Boskovic G, Denvir J, Miles S, Primerano DA, Niles RM. Global analysis of gene expression changes during retinoic acid-induced growth arrest and differentiation of melanoma: comparison to differentially expressed genes in melanocytes vs melanoma. BMC Genomics. 2008;9(1):478.
- Elizabeth Pavez Loriè, Li H, Anders Vahlquist, Törmä H. The involvement of cytochrome p450 (CYP) 26 in the retinoic acid metabolism of human epidermal keratinocytes. Biochimica et Biophysica Acta (BBA) – Molecular and Cell Biology of Lipids. 2009 Mar 1;1791(3):220–8.
- Topletz AR, Thatcher JE, Zelter A, Lutz JD, Tay S, Nelson WL, et al. Comparison of the function and expression of CYP26A1 and CYP26B1, the two retinoic acid hydroxylases. Biochemical Pharmacology. 2012 Jan;83(1):149–63.
- Bissert PT, Yantek DS, Klein MD, Yan L. Analysis of heat loss mechanisms for mobile tent-type refuge alternatives. Transactions [Internet]. 2016 Jan 1;340(1):70–4. Available from: https://pmc.ncbi.nlm.nih.gov/articles/PMC5516479/
- Puzzi L, Marchetti L, Peverali FA, Biamonti G, Giacca M. DNA-protein interaction dynamics at the Lamin B2 replication origin. Cell Cycle. 2014 Oct 30;14(1):64–73.
- UniProt [Internet]. UniProt. 2025 [cited 2025 Aug 7]. Available from: https://www.uniprot.org/uniprotkb/P10826/entry

