Bioinformatics Analysis of Gene Expression in Lynch Syndrome Progression

Bioinformatics Analysis of Gene Expression in Lynch Syndrome Progression - Drithi Raipet
ABSTRACT
Background
Lynch Syndrome is an inherited condition that primarily increases the risk of developing colorectal and endometrial cancers. It arises from germline mutations in DNA mismatch repair genes, resulting in microsatellite instability and the accumulation of genetic mutations. Individuals with Lynch Syndrome are prone to developing tumors at a young age, yet the gene expression changes that drive the progression from precancerous lesions to early-stage malignancy are not completely understood.
Method
To investigate this, gene expression data from GEO dataset GSE224707 was analyzed using GEO2R, with samples grouped into precancerous, advanced precancerous, and early-stage cancer categories. This analysis identified 296 differentially expressed genes (DEGs) based on log2 fold change thresholds. Of these, 138 genes were upregulated and 158 were downregulated (Figure 2a).
Results
Enrichment analysis using SRPlot identified several significant Gene Ontology terms, including collagen fibril organization, immunoglobulin complex, transaminase activity, protein binding, and growth factor binding. KEGG pathway analysis revealed enrichment in the Hedgehog signaling pathway.
Genes such as ZG16, KIF26B, CA1, CD177, and CXCL14 were commonly differentially expressed and associated with mucosal immunity, cellular migration, metabolic regulation, and immune surveillance. These reflect early structural and immunological shifts in colorectal tissue during Lynch Syndrome progression.
Discussion
This study highlights molecular changes that may serve as early biomarkers or therapeutic targets for Lynch Syndrome–associated colorectal cancer. The findings support future development of gene-targeted therapies aimed at delaying or preventing malignant transformation in high-risk patients.
INTRODUCTION
Lynch Syndrome (LS), also known as hereditary nonpolyposis colorectal cancer (HNPCC), is one of the most common inherited cancer syndromes [1]. LS affects approximately 1 in 300 individuals in North America and accounts for roughly 3–5% of colorectal and 2–6% of endometrial cancers [1]. It results from germline mutations in DNA mismatch repair (MMR) genes such as MLH1, MSH2, MSH6, and PMS2, which are essential in correcting errors that occur during DNA replication [2,3]. When these genes are mutated, the mismatch repair system fails, resulting in the accumulation of genetic errors and DNA instability. Over time, this instability significantly increases the risk of tumor development, particularly in the colon and rectum, but also in other organs such as the endometrium, ovaries, stomach, and urinary tract [3].
Individuals with LS often develop cancer at a younger age than the general population, and family history plays a central role in its diagnosis [4]. The inherited nature of LS means early detection and regular screening are crucial for at-risk individuals. Advances in genetic testing and bioinformatics have enabled researchers to examine tumor DNA and RNA profiles to better understand mutation patterns in these patients [5]. Notably, tumors from LS patients frequently exhibit a high number of frameshift mutations due to MSI, leading to the creation of abnormal proteins called neoantigens that may trigger immune recognition [6].
Despite these insights, many challenges remain. Specifically, while the general mechanisms behind LS and MSI are understood, the gene-level changes that drive the progression from precancerous lesions to malignant tumors remain unclear. In particular, it is unknown which specific genes are most associated with this transformation and how gene expression patterns shift during this transition. This represents a major barrier to developing effective, targeted treatments and preventive strategies, such as vaccines, for patients with Lynch syndrome [7].
This research seeks to address these knowledge gaps by identifying genes that play a key role in the progression of precancerous to cancerous lesions in individuals with LS. Using bioinformatics tools to compare gene expression in precancerous versus early-stage cancer tissues, the aim of this research is to uncover molecular patterns that signal increased cellular proliferation and reduced immune response [2,9]. It is hypothesized that patients with LS will show distinct gene expression changes that reflect this transition. By identifying these genes, this study has the potential to improve early detection strategies and enable the development of interventions that prevent cancer from developing in high-risk patients [1,4].
METHODS
Data Collection
The methods and various bioinformatics tools and databases used throughout this study to collect and analyze data are summarized in Figure 1. First, to investigate gene expression changes associated with the transition from precancerous lesions to early-stage colorectal cancer in LS, data were obtained from the National Center for Biotechnology Information (NCBI) Gene Expression Omnibus (GEO). The NCBI GEO is a resource for data analysis that contains gene datasets provided by researchers from the scientific community [10]. Relevant datasets were identified using the search terms “Lynch Syndrome” and “differential gene expression.” Among the search results, dataset GSE224707 was selected due to its specific relevance to colorectal cancer in LS patients.
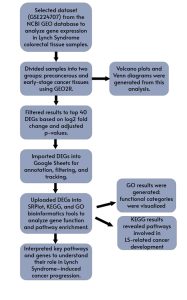
Figure 1. Summary of Research Methodology: Overview of the steps and bioinformatics tools and databases used in this study.
Identification of Differentially Expressed Genes
GEO2R, an integrated analysis tool within GEO [10], was used to compare gene expression between three groups: precancerous tissue samples, advanced precancerous tissue samples, and early-stage cancer tissue samples. GEO2R performed a no-code analysis using R programming language to identify top differentially expressed genes (DEGs), and generated output files which were utilized for visual assessment.
The output DEG table was filtered to retain the top 50 genes based on p value and adjusted log2 fold change, highlighting those with the most significant changes in expression during the transition from precancer to cancer. To statistically refine the list of differentially expressed genes (DEGs) and select the top 50 from each dataset, we applied a significance threshold of p ≤ 0.05 and log2 fold change (FC)| >1. These top 50 DEGs were then imported into Google Sheets for further processing, annotation, and tracking throughout the analysis.
Functional Enrichment Analysis Using SRPlot, KEGG, and GO
The selected DEGs were further analyzed using SRPlot, KEGG, and Gene Ontology (GO) bioinformatics tools. SRPlot provided graphical tools for visualizing gene expression patterns. KEGG was used to investigate relevant signaling pathways and molecular interactions potentially involved in early tumorigenesis. GO analysis classified the genes into functional categories based on biological processes, molecular functions, and cellular components. Together, these tools provided insight into the potential biological roles and pathways involved in the earliest stages of colorectal cancer development in Lynch Syndrome.
RESULTS
To identify differentially expressed genes (DEGs) involved in the transition from precancerous to early-stage colorectal cancer in Lynch Syndrome, GEO2R was used to compare gene expression between two tissue samples, cancerous and precancerous, which were collected from tumors. This analysis revealed that several genes were differentially expressed between the groups, indicating significant changes in gene regulation during early tumor progression (Figure 2).
The volcano plot generated from this analysis visually represented the differential expression data: red dots indicated significantly upregulated genes, blue dots indicated significantly downregulated genes, and black dots represented genes with no statistically significant change (Figure 2A). The Venn diagram displayed a total of 1,097 DEGs across the sample groups, with 128 genes overlapping between the precancerous and early-stage cancer groups, suggesting potential biomarkers common to both stages (Figure 2B).
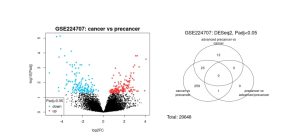
Figure 2. Differentially Expressed Genes (A) Volcano Plot, (B) Venn Diagram illustrates gene expression differences across disease progression stages based on data from GSE224707. (A) Genes with substantial upregulation or downregulation in cancer versus precancer (based on log2 fold change thresholds) are shown in red and blue, respectively. Black dots indicate genes with minimal or no expression change. (B) The Venn diagram summarizes differentially expressed genes (DEGs) identified in each pairwise comparison. From 20,648 genes analyzed, 296 were found to be differentially expressed based on log2FC cutoffs, with very limited overlap among the conditions.
To refine the list of significant DEGs, statistical filtering based on adjusted p-value and log₂ fold change was applied. This process narrowed the 20,648 gene results to the top 50 most significant genes. A full list of these 50 genes was compiled and organized for further annotation and analysis GSE224707.top.table (2)
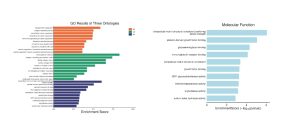
Figure 3. (a) GO Pathway Enrichment Bar Graph Across Ontologies, (b) Bar Plot of Molecular Function Enrichment. (a) Enrichment score bar plot illustrating top GO terms across biological processes (BP), cellular component (CC), and molecular function (MF) categories. Terms such as “collagen fibril organization” and “immunoglobulin complex” are enriched, reflecting structural remodeling and increased immune activity during lesion transition. (b) MF terms ranked by enrichment score and statistical significance.
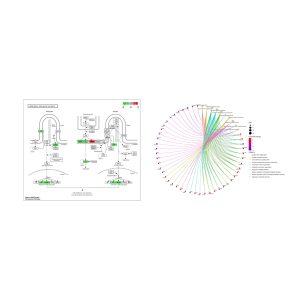
Figure 4. (a) Biological Function CNet Plot, (b) Visualization of the Hedgehog signaling pathway using Pathview. (a) Functional gene network showing the association between DEGs and enriched MF terms. Edge colors correspond to functional categories such as growth factor binding, transaminase activity, and oxygen carrier activity. COL1A2, COL3A1, and SERPINE1 showcase many connections. (b) Gene expression changes mapped onto the KEGG Hedgehog signaling pathway (hsa04340), comparing cancer to precancer stages. Genes outlined in green are downregulated in cancer, while red indicates upregulation. These changes may be associated with altered cell proliferation, differentiation, or tissue patterning during disease progression.
DISCUSSION
The aim of this research study was to investigate gene expression in the transition from precancerous to cancerous lesions within LS patients using bioinformatics tools to identify the DEGs and their pathways.
Interpretation of Results
The analysis revealed 296 differentially expressed genes (DEGs) between precancerous and early-stage cancer tissues in Lynch Syndrome (LS) patients. The volcano plot (Figure 2A) showed widespread changes in gene expression, highlighting genes that were significantly upregulated or downregulated during the transition to malignancy. A Venn diagram (Figure 2B) demonstrated that 128 DEGs were common between tissue stages, showing shared molecular features that could serve as early biomarkers of cancer progression. From these, the top 50 DEGs with the most significant log2 fold changes were selected for deeper analysis.
GO enrichment (Figure 3A) demonstrated that the DEGs were involved in biological processes such as collagen fibril organization and immune-related components like the immunoglobulin complex, implying that extracellular matrix remodeling and increased immune responses are central to lesion progression in LS. The bar graph in Figure 3b underscored statistically significant MF terms including protein binding and transaminase activity. The CNet plot (Figure 4a) further emphasized the functional importance of genes like COL1A2, COL3A1, and SERPINE1, which showed strong connections to molecular functions such as growth factor binding and oxygen carrier activity, which are functions that suggest roles in tissue invasion and abnormal signaling. Additionally, KEGG pathway mapping (Figure 4B) visualized the dysregulation of the Hedgehog signaling pathway, with several genes upregulated (in red) or downregulated (in green), highlighting altered cellular proliferation and differentiation. The Hedgehog pathway, supporting controlled tissue growth and development, is often involved in cancer to govern unchecked cell division, resistance to apoptosis, and changes in the tissue microenvironment [11]. Collectively, these results suggest that LS progression involves structural gene changes, immune modulation, and disruption of key developmental signaling pathways.
Table 1. Summary of Key Names Identified Genes in this Study
Gene ID | Gene Name | Function and Connection to Lynch Syndrome |
653808 | ZG16 | Protein involved in innate defense mechanisms. In LS, altered ZG16 expression can weaken innate intestinal immune mechanisms, resulting in increased susceptibility to tumor development. |
55083 | KIF26B | Protein that regulates cellular transport. Dysregulation of KIF26B can impair intracellular transport processes, possibly impacting cell growth and signaling in colorectal tissue. |
6236 | RRAD | Inhibits glucose uptake. Abnormal RRAD activity in LS can disrupt glucose metabolism, which can ultimately promote the proliferation of cancer cells. |
57126 | CD177 | Regulates neutrophil activity. Changes in CD177 regulation in LS can alter immune responses, impacting inflammation and tumor progression. |
54860 | MS4A12 | Signaling protein in epithelial cells. Altered MS4A12 signaling in LS may affect epithelial cell communication, potentially encouraging malignant transformation in the colon. |
Comparison with Previous Studies
The results of this study align with previous research that has identified critical gene expression changes involved in early colorectal cancer development, particularly in Lynch Syndrome (LS). The involvement of genes related to DNA mismatch repair, cell cycle regulation, and immune response has been consistently reported in LS pathogenesis [2,3,5]. Other studies have noted that inflammation-related pathways, including cytokine signaling, are often dysregulated in early colorectal tumorigenesis and may contribute to a pro-tumorigenic microenvironment [12]. The differentially expressed genes identified in this study, particularly those involved in DNA replication and cell proliferation, are consistent with genes highlighted in prior colorectal cancer datasets [8]. Furthermore, previous research has emphasized the importance of early gene expression shifts in predicting cancer progression, a concept supported by the presence of overlapping DEGs in both precancerous and early-stage cancer tissues in our study [6,8]. Together, these similarities validate the reliability of the analysis in this study and reinforce the relevance of the identified DEGs.
Implications
The identification of key genes involved in the transition from precancerous tissue to early-stage colorectal cancer in LS holds important clinical and scientific significance. These genes may serve as potential biomarkers for early detection, allowing for more precise screening protocols in high-risk LS patients. Understanding the specific genes and pathways involved in early tumor development can also inform the design of targeted therapies that interrupt or reverse cancer progression at its earliest stages.
Additionally, downregulated tumor suppressor genes may inform gene therapy strategies to restore normal cellular regulation. Overall, these findings contribute to the growing field of personalized medicine and could eventually lead to the development of more effective, stage-specific interventions for colorectal cancer in LS patients.
Limitations
Limitations in this study are caused by its reliance on publicly available bioinformatics datasets created by microarray experiments conducted by other researchers. Although these datasets supply useful information, the findings may not truly demonstrate the intricacies of LS as there was no experimentation on human samples. The identified DEGs and pathways will require more verification in laboratory or clinical settings to properly assess their roles and potential for treatment.
Future Directions
Laboratory and clinical studies are needed to validate the differentially expressed genes identified in this analysis, confirming their relevance across larger, more diverse Lynch Syndrome patient cohorts. Further investigation into how these genes contribute to the progression from precancerous lesions to malignancy, particularly in processes like DNA repair, cell proliferation, and immune evasion could clarify their biological roles. These insights may also support the development of diagnostic tools or immunopreventive strategies that leverage gene expression and neoantigen signatures to improve early detection and treatment for high-risk individuals.
References
- Maratt JK, Stoffel E. Identification of Lynch syndrome. Gastrointest Endosc Clin N Am. 2022 Jan;32(1):45–58. doi:10.1016/j.giec.2021.09.002. PMID: 34798986.
- Li GM. Mechanisms and functions of DNA mismatch repair. Cell Res. 2008 Jan;18(1):85–98. doi:10.1038/cr.2007.115.
- Kloor M, Reuschenbach M, Pauligk C, Karbach J, Rafiyan MR, Al-Batran SE, et al. A frameshift peptide neoantigen-based vaccine for mismatch repair-deficient cancers: a phase I/IIa clinical trial. Clin Cancer Res. 2020 Sep 1;26(17):4503–10. doi:10.1158/1078-0432.CCR-19-3517. Epub 2020 Jun 15. PMID: 32540851.
- Peltomäki P, Nyström M, Mecklin JP, Seppälä TT. Lynch syndrome genetics and clinical implications. Gastroenterology. 2023 Apr;164(5):783–99. doi:10.1053/j.gastro.2022.08.058. Epub 2023 Jan 24. PMID: 36706841.
- Sveen A, Agesen TH, Nesbakken A, Meling GI, Rognum TO, Lothe RA, et al. Transcriptome instability in colorectal cancer identified by exon microarray analyses: associations with splicing factor expression levels and patient survival. Genome Med. 2011 Sep 12;3(9):32. doi:10.1186/gm266.
- Bolivar AM, Duzagac F, Deng N, Reyes‑Uribe L, Chang K, Wu W, et al. Genomic landscape of Lynch syndrome colorectal neoplasia identifies shared mutated neoantigens for immunoprevention. Gastroenterology. 2024 May;166(5):787–801.e11. doi:10.1053/j.gastro.2024.01.016. Epub 2024 Jan 18. PMID: 38244726; PMCID: PMC11034773.
- Houwen BBSL, Hazewinkel Y, Pellisé M, Rivero-Sánchez L, Balaguer F, Bisschops R, et al. Linked colour imaging for the detection of polyps in patients with Lynch syndrome: a multicentre, parallel randomised controlled trial. Gut. 2022 Mar;71(3):553–60. doi:10.1136/gutjnl-2020-323132. Epub 2021 Mar 18. PMID: 34086597; PMCID: PMC8862075.
- de Sousa e Melo F, Colak S, Buikhuisen J, Koster J, Cameron K, de Jong JH, et al. Methylation of cancer-stem-cell-associated Wnt target genes predicts poor prognosis in colorectal cancer patients. Cell Stem Cell. 2011 May 6;9(5):476–85. doi:10.1016/j.stem.2011.10.008.
- Tang D, Chen M, Huang X, Zhang G, Zeng L, Zhang G, Wu S, Wang Y. SRplot: A free online platform for data visualization and graphing. PLoS One. 2023 Nov 9;18(11):e0294236. doi: 10.1371/journal.pone.0294236. PMID: 37943830.
- Tanya Barrett, Stephen E. Wilhite, Pierre Ledoux, Carlos Evangelista, Irene F. Kim, Maxim Tomashevsky, Kimberly A. Marshall, Katherine H. Phillippy, Patti M. Sherman, Michelle Holko, Andrey Yefanov, Hyeseung Lee, Naigong Zhang, Cynthia L. Robertson, Nadezhda Serova, Sean Davis, Alexandra Soboleva, NCBI GEO: archive for functional genomics data sets—update, Nucleic Acids Research, Volume 41, Issue D1, 1 January 2013, Pages D991–D995, https://doi.org/10.1093/nar/gks1193
- Carballo, G.B., Honorato, J.R., de Lopes, G.P. et al. A highlight on Sonic hedgehog pathway. Cell Commun Signal 16, 11 (2018). https://doi.org/10.1186/s12964-018-0220-7
- Kane MF, Loda M, Gaida GM, Lipman J, Mishra R, Goldman H, et al. Methylation of the hMLH1 promoter correlates with lack of expression of hMLH1 in sporadic colon tumors and mismatch repair-defective human tumor cell lines. Cancer Res. 1997 Nov 1;57(16):808–11.
- Deng Y, Yu L, Zhao Y, Peng J, Xu Y, Qin J, et al. RCC1 expression as a prognostic marker in colorectal liver oligometastases. Pathol Oncol Res. 2021 Dec 2;27:1610077. doi:10.3389/pore.2021.1610077. PMID: 34924821; PMCID: PMC8674189.
- Terzić J, Grivennikov S, Karin E, Karin M. Inflammation and colon cancer. Gastroenterology. 2010 Jan;138(6):2101–2114.e5. doi:10.1053/j.gastro.2010.01.058.

